The exercises below are all real data and are often cases where there have been particular difficulties in the analysis. All use Applets. If an Applet locks up on you, just press the "Refresh" button. It is possible for you to change some of the features of the Applet by editing the driving program. For example, the size can easily be changed by changing the pixel value of the width or height. The easiest way of doing this is to use the program NotePad to edit the file called "exercises". If you are operating in Explorer this program automatically comes up with the text of "exercises" if you choose "View" and then select "Page Source".
All scattering length densities (SLD) quoted have been multiplied by 106.
1. The data shown in the Applet below is the neutron reflecivity of a commercial sample of ITO on glass. The SLD of bulk glass and bulk ITO are 3.8 and 4.07 respectively. Glass normally has a gel layer at its surface with an SLD up to 10% lower than its normal value and it will become evident during the fitting that there must be some non-uniformity in the ITO. Include the glass gel layer and try putting an additional ITO layer next to the glass to optimize your fit. When you have succeeded try some quite different combinations to check that there are not alternative models that will fit the data.
2. The data shown in the Applet below is the neutron reflecivity of a layer of deuterated surfactant in null reflecting water, which can be accurately fitted with a single layer model. To guide the fitting that you will do in the exercise the sum of the squares of the differences between the logs of the calculated and observed points is printed out on the screen as "R". In common with all the other exercises the backgound fitting is handled independently and you can ignore any complications from background subtraction.
(i) Find the best fit to the data using the minimum value of R as the criterion for the best fit.
(ii) Make a table of 4 columns for thickness, SLD, the product of thickness and SLD, and R. Starting from your best fit first vary thickness thickness by about 0.1 nm at a time, noting the value of thickness and the value of R in your table. Then return to the best fit and repeat the exercise varying SLD by about 0.1 and keeping thickness constant. Finally, return to the best fit, and now again vary thickness by about 0.1 but this time adjust the SLD to obtain minimum R and record the values.
(iii) Plot graphs (if you have no graph paper, squared paper will be accurate enough) of (a) thickness (SLD constant) against R, (b) SLD (thickness constant) against R, (c) thickness against R (SLD optimized) and (d) product of thickness and SLD against R (a selection of suitable values in the table).
(iv) Deduce from your plots the % accuracy of your determination of the thickness of the layer and the product of thickness and SLD.
(v) Given that the scattering length density of the layer equals the scattering length of the molecule, b divided by the product of the area per molecule and the thickness, and that b is 3.9 x 10⁻⁶, calculate the area per molecule at the surface.
3. This exercise is concerned with the structure of adsorbed layers of surfactants at the silica/water interface. The surfactants have the general formula C8H17φ(C2H4O)6OH, where φ is a benzene ring. All surfactants tend to adsorb at the water/silica interface in bilayer type structures where the hydrophilic (C2H4O)6OH groups (abbreviated to E6) form the outside of the layer next to the water and the inside next to the silica. The hydrophobic groups are sandwiched in the middle. The coverage of the surface by the surfactant bilayer is usually not complete.
When these layers are examined in D2O there is enough hydration of the hydrophilic groups that these have a different SLD from the hydrophobic core and therefore it is possible to demonstrate the sandwich structure of the layer without any special deuterium labelling of the surfactant. The two Applets below are alternative approaches to fitting such data.
(i) The data in the basic Applet below is for one of these compounds. Noting that the substrate layer is D2O (SLD = 6.35) and the top layer is silicon (SLD = 2.07) fit the data as best you can using a symmetrical three layer structure for the surfactant and an SiO2 layer of approximately 1.5 nm thickness and SLD of 3.4. When you have a fit
(a) Calculate the volume fraction of hydrophobic group in the central layer from your value for the scattering length density of the central layer assuming that the SLD of the hydrophobic group is zero and that of D2O is 6.35. Do the same for the hydrophilic groups.
(b) Compare the total volumes of hydrophilic and hydrophobic groups (sublayer thickness x volume fraction). The ratio should be the ratio of the volumes of the two parts of the surfactant (very approximately 1:1). If this condition is not approximately satisfied your fit is invalid and you will have to start again.
(c) Estimate the fraction of surface covered from the volume fraction of hydrophobic group estimated in (b).
(ii) The fitting and calculation in (i) is a very primitive and cumbersome way of fitting such data. The Applet below is much easier to use. Essentially, it has the stoichiometry condition in part (i)(b) above included in the calculation.
Fit the four sets of data included with this Applet, each of which is a different isomer of the same basic formula given at the start. The bare silica data is included for comparison. One of the sets of data corresponds to that used in part (i). Can you identify it?
5. The Applet below shows reflectivity profiles at three contrasts for a bolaform surfactant (one with positive charges at each end of a straight hydrocarbon chain, i.e. with hydrophilic groups at each end of a hydrophobic group) adsorbed at the air/water surface. The object of the experiment was to see (a) how the molecule orients itself at the surface and (b) to determine the extent to which the molecular layer is immersed in the water. The "Choice . . ." button shows the contrast profile on the right for whichever data is highlighted in red.
(i) Use the data for the deuterated surfactant in null reflecting water (NRW) to fix the area per molecule and a provisional value of the thickness. note the string sensitivity to the area but the poor sensitivity to the thickness (this is because the layer is too thin to show any signs of an interference fringe).
(ii) The fit the three sets of data simultaneously using the other variable parameters. The volume of the molecule is important because it determines the amount of water displaced. The correct value for the volume is 0.5 nm3.
(iii) What can you deduce about the structure and composition of the layer, bearing in mind the unusual nature of the distribution of hydrophilic groups in the molecule?
6. This exercise is concerned with the structure of the air/aqueous surface of a mixture of negatively charged polyelectrolytes and positively charged surfactants. The adsorption of the surfactant at the surface is greatly enhanced by the presence of the polyelectrolyte. At the lower concentration of surfactant the surfactant adsorbs as a monolayer but at the higher concentration it forms an additional layer underneath the water. The thicknesses of these two layers are fixed in the Applet shown below but the amounts in and the separation between the two layers can be varied. There are two systems to be studied, DNA and C12TAB and poly(sodium acrylate) (PAA) and C12TAB (press the button "Select System" to change to the PAA/C12TAB system). There is a third system but this should be ignored.
(i) Fit the area per molecule of the lower concentration data for both polyelectrolyte systems.
(ii) Fit the data at the higher concentration for both systems. The way the program works is that above a saturated limit for the monolayer all the remaining surfactant is put in the sublayer (the area per molecule of C12TAB in a monolayer varies between about 0.45 and 0.60 nm2 depending on what else is present). You can select the point of saturation by adjusting the area per molecule in the monolayer to a chosen value and then fixing it by pressing the button "Set Monolayer".
(iii) When you have optimized your fits at the higher concentration use the two polymer buttons to assess whether or not the experiment is sensitive to the presence of polyelectrolyte between the two layers and below the sublayer. One slider controls the volume fraction in these layers and the other controls the extent to which polymer penetrates the surfactant layers.
(iv) On the basis of your results in (iii) suggest what combination of isotopic labelling would be most sensitive to the polylectrolyte distribution in the system.
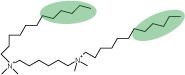
7. The optimum set of contrasts to determine a particular surface structure is sometimes difficult to choose. Given the way neutron beam time is allocated, one usually has to guess and hope for the best. The following set of data was aimed at determining the structure of a surfactant layer where the surfactant can be divided into four parts. The surfactant is sketched in a possible surface conformation below. The chains consist of a lower hydrocarbon part and an upper fluorocarbon part (shaded green). Both these fragments are hydrophobic and they tend not to mix with each other. The other two fragments of the surfactant are the heads (taken together) and the spacer, connecting the two identical halves of the surfactant together to make a so-called gemini surfactant.
The reflectivity data for 6 contrasts is indicated in the labels for each profile in the Applet below. For the pruposes of this exercise you can assume that F has a similar scattering length to D. Fdhh indicates that the hydrocarbon part of the chain is deuterated and Fhhd indicates that the spacer is deuterated.
(i) Use the 3 NRW contrasts to determine the average area per molecule. You will need to use the "Area per molecule" and the "Variation of Area" buttons. Small isotope effects and slight differences in purity cause the variation from sample to sample.
(ii) The number of parameters incuded in the Applet for fitting the data is overoptimistic. Some of them are redundant. You can effectively remove a separation parameter by setting it to zero and holding it at that while you do the rest of the fit. Given this information determine
(a) The average structure of the molecule. In doing this you are advised to set the "D2O scaling" to its maximum value (differences here sometimes arise because of imperfect alignment when doing the experiment) and to keep the area per molecule as fitted in (i).
(b) The separation parameters that are redundant.
(iii) What additional contrast would you suggest for determining the redundant parameter(s)?
The "RQ4" button at the bottom of the Applet opens up a more sensitive way of fitting the data. It eliminates the strong momentum transfer dependence of the reflectivity and puts the data on a linear rather than a log scale. You do not need to use it.