Liquids
The density of a liquid is only slightly different from that of the corresponding solid and hence the mean separation of the molecules must be comparable in the two states. The fundamental differences between the solid and liquid states are that there is long range order in the solid and that on a very short time scale a molecule in a liquid "explores" the whole space occupied by the liquid.
The Radial Distribution Function
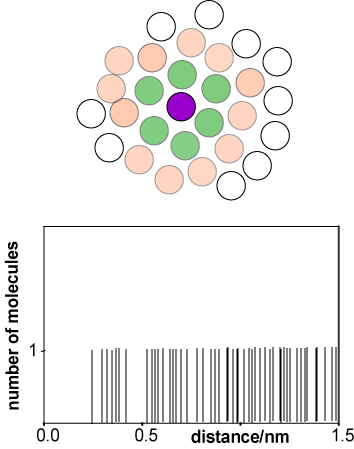
The rapid molecular motion in a liquid and its lack of long range order make it difficult to describe. The function that is used to describe its average structure is the radial distribution function, usually written g(r). To construct g(r) we start by taking an instantaneous snapshot of liquid, as shown in a 2-D representation in the diagram alongside. With reference to the purple coloured molecule there are two groups of molecules, one whose centres are at a distance of about a molecular diameter from that of the reference molecule (green) and one whose centres are at about two molecular diameters (pink). The range of distances between the reference molecule and the molecules in the first coordination shell is much narrower than for the second coordination shell.
Taking the centre of the purple reference molecule as being at r = 0 we construct a histogram of the molecules at a given distance r from the reference molecule. A typical result would be as shown in the second diagram (distances correspond to liquid argon). The first coordination shell gives rise to a noticeable cluster whereas the second coordination shell is more diffuse, and it becomes difficult to discern a pattern for subsequent coordination shells. We now repeat this process for every other molecule in the liquid, taking as reference molecules A, B, C, D, etc. for the same instantaneous snapshot (see figure below). Each gives a slightly different histogram. Finally we average the results of all the histograms. The resulting plot, shown below right for liquid argon at its triple point, gives the probability of finding a molecule at a given distance from any chosen central reference molecule.
|
|
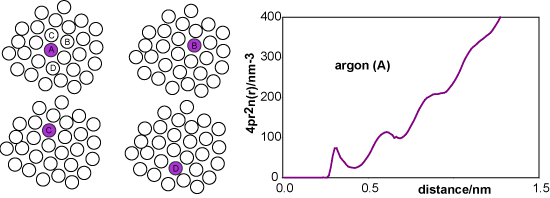
A more convenient way of representing the structure of the liquid is to remove the 4πr2 factor from argon (A) to obtain the radially averaged number density distribution, argon (B). The radial distribution function, argon (C) or g(r), is obtained by dividing argon (B) by the bulk number density, nbulk. This distribution function has the simplifying feature that it tends to unity at large r.

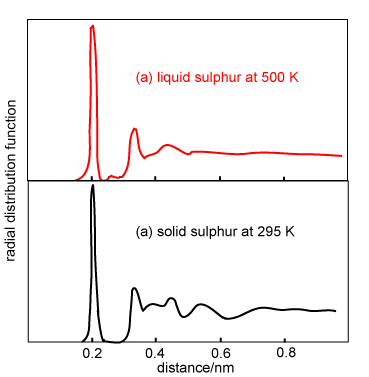
The qualitative appearance of radial distribution functions for monatomic liquids is similar. There is an obvious first coordination shell and some indication of at least a second coordination shell. However, molecules (as distinct from atoms) may have g(r) of more complex appearance. On the right are shown the g(r) for solid and liquid sulphur. Sulphur forms crown-shaped S8 rings in both solid and liquid states. The well-defined molecular structure of the S8 molecules gives rise to a sharp peak at 0.206 nm (the S-S distance in the ring). In the solid state the peak in g(r) corresponds to precisely two nearest neighbours. When sulphur melts the ring structure persists but there is some bond breaking, which causes the intramolecular peak at 0.206 nm to drop slightly in intensity (1.7 nearest neighbours). A small new peak also appears at 0.27 nm. The longer range structure that is present in g(r) for the solid is also largely washed out in the liquid.
|
|
|
|
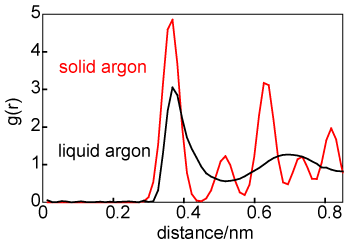
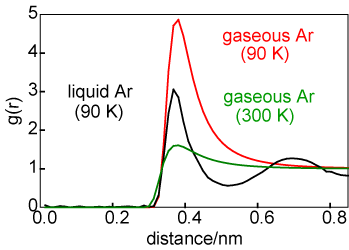
The difference in average structure between a solid and a liquid can be illustrated by consideration of the structures of liquid and solid argon at coexistence, as shown by the g(r) in the diagram above on the left. For the solid the atom positions have been taken to be those for a face centred cubic lattice but with a significant amplitude of vibration. The number of atoms in the first coordination shell is about the same in liquid and solid (exactly 12 in the solid) but the two structures become quite different after the first coordination shell. The difference in average structure between a gas and a liquid can also be illustrated in terms of the radial distribution functions, as shown on the right. The liquid g(r) is shown in black and the g(r) for the gas is shown at two temperatures, 90 K (in red) and 300 K (in green). At first glance there appears to be more correlation in the gaseous state than might be expected. However, it must be remembered that g(r) is normalized to a density of unity. The gas phase density is very low and so, although there is a large peak in g(r) at 90 K, the absolute number of atoms clustered around the central reference atom is minute. [g(r) for a gas is very simple; it is exp(-U(r)/kBT).]
Thermodynamic Properties of Liquids
Based on the description of a liquid in terms of the radial distribution function a number of equilibrium properties can be understood and quantified. The calculations are necessarily approximate at this level, but can be made quite accurate in many cases. The simplest illustration is the enthalpy of vaporization. First, we make the approximation that there is no difference between the enthalpy and internal energy of the liquid. Then all we need to do is to calculate the energy required to remove our central reference molecule from the liquid. The full calculation would be an integration over the product of g(r), the pairwise energy U(r) and 4πr2. A less accurate estimate is to calculate the number of nearest neighbours (by integrating 4πr2g(r) over the first coordination shell) and multiplying it by the value of U at the mean position of the centres of the first shell molecules. Quickest of all is to take the nearest number of neighbours to be 12 and multiply this by the well depth (ε) in the pair potential. In each of the three calculations the energy (enthalpy) of vaporization is finally obtained by halving the value to allow for it having been calculated as an interaction between pairs of molecules.
The close similarity of solid and liquid in terms of nearest neighbour distributions and distances makes it impossible to make even an approximate estimate of the enthalpy of fusion. Typically, fusion is accompanied by a 10% expansion. Given that the position of the atoms in the solid state is about at the minimum energy of the pair potential (r = 21/6σ and U = -ε), the Lennard-Jones potential would give an enthalpy of fusion of about 15% of the enthalpy of vaporization. However, this value is too sensitive to the exact amount of expansion, which is not easily estimated, and to the exact value of the intermolecular separation in the solid relative to the Lennard-Jones potential, to make it worth calculating. Its small value demonstrates the generally greater similarity between solid and liquid than between gas and liquid. This is also borne out by the heat capacities of solid and liquid, which are usually similar.
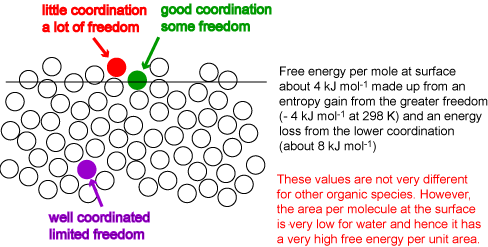
A final thermodynamic quantity that can, in principle, be estimated is the surface energy. The coordination of a molecule must be reduced at the surface of the liquid. The creation of a surface therefore requires an input of energy. The situation is complicated by two factors. First, a molecule at the surface also gains entropy from its greater freedom of movement and hence the surface free energy, which is what is most easily measured, is very different from the surface energy. Secondly, the surface energy is measured per unit area, not per mole. We neglect the second problem for the moment by focussing on the surface energy per mole (or molecule). The surface layer of molecules will adjust their coordination to optimize the gain in entropy and the loss in energy. The result is somewhat like the surface on the right of the diagram below. This has an average layer intermediate in density between bulk and vapour and the coordination of a molecule in this surface layer is much less than half its value in the bulk. However, the remaining molecules on the surface, the majority, remain extensively coordinated, i.e. the average coordination remains quite high. The perfect surface on the left is physically unrealistic because it does not allow for thermal fluctuation (alternatively, it unrealistically restricts the possible gains in entropy resulting from a more disordered surface). Values of the energy per mole indicate that the level of coordination drops by between a third and a quarter of what it is in the bulk, i.e. to 8 or 9 atoms, compared with 12 in the bulk, i.e. the surface energy per mole is between one third and one quarter of the energy of vaporization. The surface energy per unit area, which is what can be determined experimentally, is obtained by dividing the energy per mole by the area per mole (molecule). This varies much more dramatically from molecule to molecule. For example, benzene and octane have higher surface energies per mole than water but their much greater sizes result in surface energies per unit area that are less than half that of water.
Diffusion in Liquids
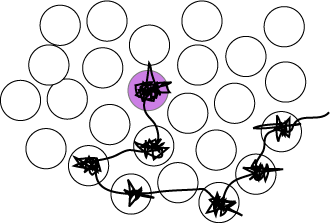
Most chemical reactions take place in solution and the way reactants approach is therefore important to understand at the molecular level. Consideration of the structure of a liquid with its well defined first coordination shell suggests that much of the time a molecule will just oscillate backwards and forwards within this shell. This is supported by the close similarity of the heat capacities of solids and liquids, already commented on above. However, all the molecules in a liquid are free to move and as the structure of the first coordination shell fluctuates it will be possible for the central molecule to jump to a new position. The overall motion will then be one of a few periods of oscillation in more or less the same position with occasional random jumps to new positions. A schematic diagram of the track of the centre of mass motion of a molecule is shown in the figure. It is the jumps between different positions that bring about diffusion of the molecule through the liquid. The diffusional motion sketched qualitatively in the figure can be treated by the transition state theory of chemical kinetics and provides a particularly clear example of the issues in TST.
|
|
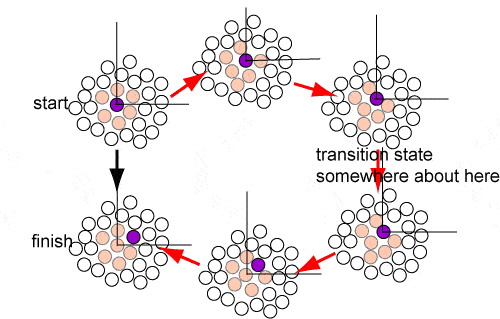
The transition state for the diffusive motion must involve the loss of some coordination energy and an energy penalty as the molecule squeezes its way past other molecules. The diagram below attempts to represent this. The initial and final states are the two on the left of the diagram and a possible progression through intermediate states follows the sequence of red arrows. The energy of the transition state is higher than the surrounding states because it involves some closer approaches than the optimum separation and some void creation. It is not easy to estimate this but, from the discussions about energies of vaporization and surface energies, the energy of the transition state would probably be a bit less than the surface energy per mole, i.e. the activation energy for diffusion should be in the range 20-25% of the energy of vaporization. In transition state theory, the rate is the product of the probability of being in the transition state times the frequency with which it is sampled, which will be the frequency of oscillation within the coordination shell.
For motion along a particular direction the mean energy is kBT for vibrations (E = hν) and hence ν = kBT/h. The rate is therefore (kBT/h)exp(-E‡/kBT) where E‡ is 20-25% of the enthalpy of vaporization. The rate of diffusion is determined by the velocity of the jump and the distance jumped, where the velocity is the distance jumped multiplied by the frequency. Hence the diffusion coefficient is finally
(kBT‹a2›/h)exp(-E‡/kBT)
where ‹a2› is the mean square jump distance. For typical liquids at room temperature, ‹a2› is 0.2 x 10⁻¹⁸ m2, enthalpies of vaporization are 30-40 kJ mol−1 (hence E‡ = 10 kJ mol−1), and kBT/h is about 5 x 10¹³, giving a typical diffusion coeficient of 2 x 10⁻⁹ m2 s−1.
|
|
|
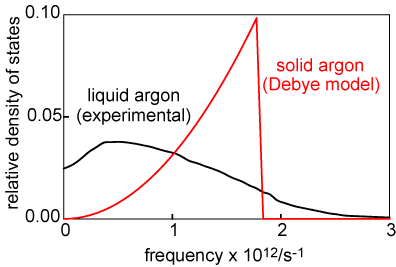
The simple TST model gives a good account of diffusion in a liquid. It is not usually explicitly stated in TST that the rate of the reaction is the density of motions along the reaction coordinate at zero frequency. The reason is that these are the motions where the molecule carries on through the transition state to the products. Any motions of non-zero frequency result in the molecule being reflected back from the transition state, i.e. no reaction. In the case of diffusion in a liquid it is possible to determine the spectrum of motions experimentally and these are shown for liquid argon in the diagram alongside (in black). The motions of the solid (calculated according to the Debye model of vibrations in the solid state) are shown in red. There is no diffusion in the solid state so there are no vibrations at ν = 0. The spectrum of the liquid shows tht there are both oscillations of the type discussed earlier and zero frequency diffusive motions. The intercept on the ν = 0 axis is directly proportional to the diffusion coefficient.
|
Solutions
The starting point for considering the properties of solutions is the thermodynamics of mixing. For random mixing of molecules of comparable size the entropy of mixing is
ΔS = − R(xAlnxA + xBlnxB)
where xA and xB are the mole fraction of the two components. This formula holds reasonably well, although it cannot be derived theoretically without assumptions whose validity is difficult to assess. Ideal solutions are those for which the enthalpy of mixing is zero and the entropy of mixing is given by the above formula. This leads to a combined single definition of the ideal solution as one for which the chemical potential of each component is
μi = μoi + RTlnxi
The properties that follow from this definition have been covered in the first year. Here, we examine the so-called regular solution for which the entropy of mixing is exactly the same as for the ideal solution but the enthalpy of mixing is no longer zero.
We take the coordination number of any molecule in the liquid to be z and we assume that mixing is random and that, on average the coordination number is the same for molecules A as it is for molecules B. Nearest neighbours contribute wAA, wBB or wAB to the energy. For a single reference molecule A the binding energy is
E = z(xAwAA + xBwAB)/2
where the factor of a half allows for the pairwise interaction. There is a similar expression for a single B. If there are nA molecules of A and nB molecules of B then the total energy is
ΔE = z[(nAxB + nBxA)wAB + nAxAwAA + nBxBwBB]/2
This is the total energy. To obtain the contribution resulting from mixing only we subtract the binding energies for pure A and pure B, i.e. znAwAA/2 and znBwBB/2 respectively to obtain
ΔEmixing = z[(nAxB + nBxA)wAB + nA(xA − 1)wAA + nB(xB − 1)wBB]/2
Dividing through by (nA + nB) gives
ΔEmixing = xAxBz[wAB − wAA/2 − wBB/2] = βxAxB
The interaction parameter β is the parameter that determines the deviation from ideal behaviour. The theory of dispersion forces shows that εAB = (εAεB)1/2. Equating w to − ε in the Lennard-Jones potential gives the result that β = (εA1/2 − εB1/2)2. Hence β and the enthalpy of mixing should always be positive if the only forces are dispersion forces. Combining the ideal entropy of mixing with the above model for the enthalpy of mixing gives the following expression for the chemical potential:
μA = μoA + RTlnxA + βxB2


