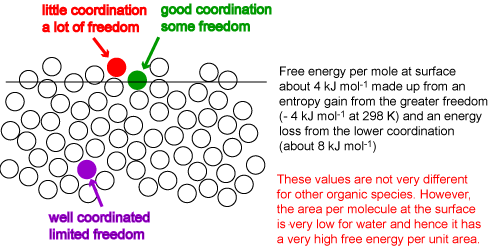
At the surface of a liquid the coordination of a molecule is reduced. The creation of a surface therefore requires an input of energy. A molecule at the surface also gains entropy from its greater freedom of movement. The surface layer of molecules will adjust their coordination to optimize the gain in entropy and the loss in energy. The result is somewhat like the surface in the diagram below. This has an average layer intermediate in density between bulk and vapour and is rough. The coordination of some molecules in the surface is much less than in the bulk but some retain a high level of coordination. The roughness is not static and is subject to thermal fluctuation. These fluctuations can be seen in the java applet shown below (this is identical with the one already shown in Liquids and Solutions. Set the interaction energy to its most positive value (corresponding to phase separation) and use the reset button to obtain the separated phases, then start. Even at the lowest temperature the interfacial fluctuations are very large. Values of the energy per mole at a surface indicate that the level of coordination drops by between a third and a quarter of what it is in the bulk, i.e. to 8 or 9 atoms, compared with 12 in the bulk, i.e. the surface energy per mole is between one third and one quarter of the energy of vaporization. The surface energy per unit area, which is what can be determined experimentally, is obtained by dividing the energy per mole by the area per mole (molecule). This varies much more dramatically from molecule to molecule. For example, benzene and octane have higher surface energies per mole than water but their much greater sizes result in surface energies per unit area that are less than half that of water. The surface free energies of benzene, octane and water at room temperature are respectively 29, 22 and 72 mJ m-2. The free energy required to create a given area of water surface is more than three times higher for water than for octane.

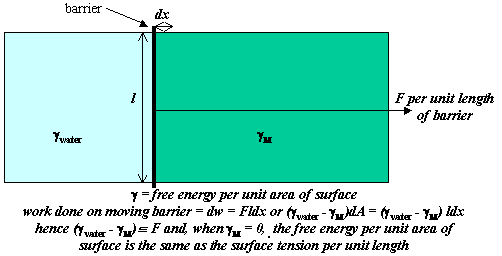
In the Figure below an insoluble oil (largely hydrocarbon) has been spread on the surface of water on the right hand side of a barrier that separates the covered water surface from clean water on the left hand side of the barrier. Note that not all oils will spread, some may form droplets. We assume that this is a spreading oil and that it effectively creates a monomolecular film of hydrocarbon. From the discussion in the previous section the free energy per unit area, designated γ, is higher for water than for the spread monolayer. Since the system will act to reduce its free energy, there will be a pressure (the spreading pressure) acting to move the barrier to the left, which depends on the difference in the two free energies per unit area. The argument below shows that the free energy per unit area of a single surface is exactly equivalent to the tension exerted per unit length (mJ m-2 = mN m-1). Since the determination of the surface free energy has nearly always been done by a measurement of the force exerted by a surface, the term surface tension is customarily used for surface free energy, i.e. the surface tension of water is 72 mN m-1.
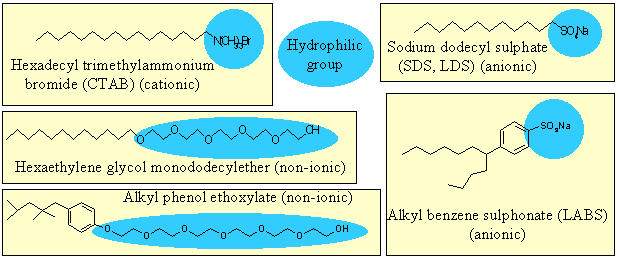
Amphiphilic molecules contain both hydrophobic groups, e.g. hydrocarbon, and hydrophilic groups. The interaction of the hydrophilic group with water is often enough to ensure that the compound is soluble. The surface free energy of a surface covered with hydrophobic groups is much lower than that of water. There is therefore a strong tendency of amphiphilic molecules to adsorb at the surface of water in order to lower its free energy. Ethanol is an example of a weakly amphiphilic molecule. Examples of more strongly amphiphilic molecules are soaps and detergents, for which a selection of formulae is shown below.
The surface tension of ethanol is about one third that of water, i.e. 22 rather than 72 mN m-1. In a solution of ethanol in water it is therefore thermodynamically favourable for ethanol to occupy the surface. Indeed, it is especially favourable because the hydrocarbon part of the molecule will tend to form the air side of the interface because of the hydrophobic effect, while the OH remains hydrogen bonded to the water. However, adsorption of ethanol at the surface will be opposed by the loss of entropy of mixing. Ethanol has characteristics of an amphiphilic molecule. All amphiphilic molecules will have a strong tendency to adsorb at the surface of water and the balance between the lowering of the surface free energy by adsorption and the increase in free energy of the solute associated with being localized in the surface region is the basis of the important Gibbs equation, which relates the change of surface tension with concentration to the amount adsorbed at the surface.
The internal energy of the system is

where Us is the excess internal energy associated with the surface and the other two terms are the internal energies of the two bulk phases. The differential internal energy of a bulk phase is

In the analogous equation for the surface the expansion work (−PdV) is replaced by the work of changing the surface area (+γdA) and the differential internal energy of the surface is

This equation may be integrated over the extensive quantities, S, A and ni, keeping the intensive quantities T, γ and μs constant to give

Differentiation of B gives

Subtraction of [A] from [C] gives

Rearranging this equation and taking the condition of constant temperature gives

The chemical potential for component i is

and therefore

Substituting this in equation (4) and restricting the system to two components gives


where &Gammai is the surface excess of component i. The Gibbs equation relates the change in surface tension to the activities (approximately the concentrations) and the surface excesses of the two components. However, the significance of &Gamma1 and &Gamma2 depends on the definition of the dividing surface. It is normally chosen so that the surface excess of the solvent disappears. Then

The Gibbs equation can be used to calculate the amount of a solute adsorbed from measurements of the surface tension. The slope of a plot of γ against logc is proportional to minus the amount of solute adsorbed. This is illustrated in the Gibbs isotherm java applet shown below. The parameters in this calculation are typical of surfactants adsorbed at the surface of water. For the purposes of this applet the adsorption is taken to follow a simple model, which assumes the molecules in the adsorbed layer do not interact with each other but that the layer becomes saturated when the layer is full, i.e. the maximum adsorption is a monolayer. adsorption. The Gibbs equation corresponding to the adsorption on the right is plotted on the left. The pink circle can be moved by adjusting the adsorption bar. The tangent on the left corresponds to the position marked on the isotherm on the right. The Gibbs equation plot is cut off at a surface tension of 25 mN/m because equilibrium surface tensions seldom fall much below this. This cut-off could, for example, correspond to a solubility limit (see next figure).
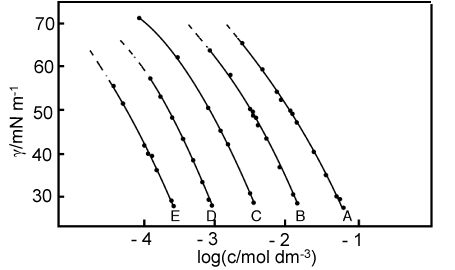
The figure below shows examples of the variation of the surface tension with logc for a series of n-alkanols of different chain length. The shortest one, labelled A, is hexanol and all the curves terminate at the limit of solubility. In each case the magnitude of the slope of the curve is greatest at the highest concentration, i.e. the adsorption is a maximum at high concentrations. This is expected because the entropy loss on adsorption is less at higher concentrations. The limiting slopes at high concentration are fairly similar, although there is a slight increase in slope as the chain length increases. These observations (and the actual value of the adsorbed amount) are consistent with the molecules forming vertically close-packed layers. This would make them have similar areas per molecule, i.e. similar adsorbed amounts in mol m-2 but the attractive van der Waals forces between adjacent hydrocarbon chains would cause the longer chains to be slightly more tightly packed. The negative slopes of these graphs become less at low concentrations, corresponding to reduced adsorption. Further examples are in the first problem set. For ethanol (not shown in the figure) the adsorption and the variation of surface tension with concentration are such as to lead (with other kinetic effects) to the phenomenon of the "tears" of wine in a wine-glass.
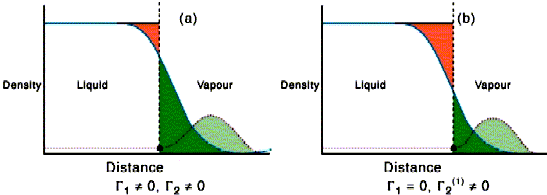
The derivation of the Gibbs equation assumed that the system could be divided into the two bulk phases separated by an infinitely sharp interface. The surface thermodynamic properties, Us etc. are then those of the real system less the ideal sharply divided bulk phases. The surface excesses Γi literally measure the difference in the actual amount of i in the system compared with that given by the sharp distribution, divided by the area. It may be positive (adsorption) or negative (depletion). This definition is very clear from a thermodynamic view but is only simple when there is strong adsorption from dilute solution. The surface excess of the solvent in the left hand side of the figure below is obtained by summing the red (negative excess relative to the uniform solvent) and green (positive excess). On the right hand side the dividing surface has been moved so that the red and green regions sum to zero, i.e. the dividing surface has been placed so that there is no adsorption of solvent. The dividing surface is often taken as being at the point where there is no nett adsorption of solvent. Note that the surface excess of solute is different between the left and right hand sides of the diagram. This difference is insignificant in most cases of amphiphile adsorption because adsorption is strong and the bulk solution concentration is low. The difference would not be insignificant for ethanol/water.
In bubbles and liquid drops the surface is no longer flat and this has some important consequences. Thus, a bubble in a liquid has a free energy associated with its surface, γA. If the radius of the bubble changes by dr the surface area of the bubble changes and the change in the free energy is given by

Thus the free energy change for a decrease in the bubble radius is negative and the bubble will collapse unless there is some compensating change of free energy. The only possible way of maintaining the bubble radius is if the pressure in the bubble is greater than that outside. This makes a contribution to the free energy of

At equilibrium the two contributions to the free energy must cancel and

This is Laplace's equation. It shows that the pressure inside a bubble is inversely proportional to its size. Thus, in a foam of different bubble sizes the smaller ones will be destabilized relative to the larger ones.
The free energy associated with the surface is also key to understanding nucleation phenomena. Consider a droplet of liquid forming in steam at pressure P. There will be two contributions to the free energy, that of the surface

and that from the formation of the liquid that forms the drop, which is

where po is the saturated vapour pressure. The number of moles n is

where VM is the molar volume of the liquid. The total free energy is therefore

The variation of the free energy with radius of the drop is as shown below
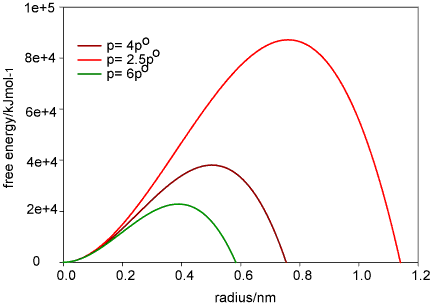
At equilibrium the two free energy terms balance and

The vapour pressure above small liquid drops is therefore larger, the smaller the drop. Similar equations hold for all small particles in a different phase from the surrounding material, e.g. bubbles in liquids, crystals in solutions or molten liquid, etc.
There are two good books that cover this area, Dill & Bromberg (see synopsis) and The Colloidal Domain,2nd Edition, by Evans and Wennerstrom. In addition, there is an extensive and beautiful set of video clips on a CD accompanying the book, Capillarity, etc. by de Gennes, Brochard and Quere. The text of this book is much more advanced than needed for this lecture course. However, it is worth persuading your college library to get and you can browse through the CD for clips that are of interest.
This link connects directly to an entertaining video of what is probably explosive nucleation of diet coke by mentos at http://www.funny-videos.co.uk. You need to be connected to the Web to make the link.
To download and operate the applets on your own computer download gibbs.jar and the file GibbsApplet.html for the Gibbs equation and ising.jar with IsingApplet.html for the simulation. Put the files in one folder and double click on the appropriate html file icon.