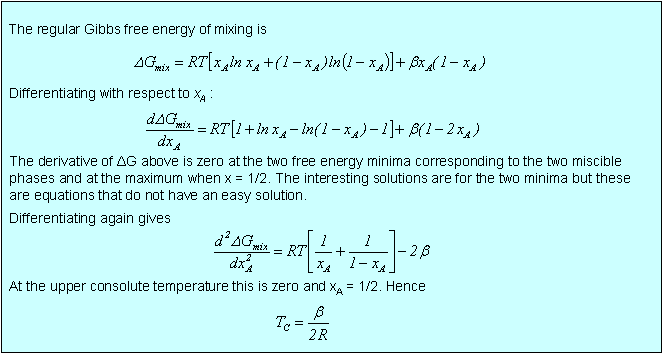


When two pure substances mix under normal conditions there is usually an increase in the entropy of the system. This is qualitatively easily visualised in terms of the increased disorder brought about by mixing. For the mixing of two ideal gases it is straightforward to obtain an expression for the entropy of mixing. Since the molecules of ideal gases do not interact the increase in entropy must simply result from the extra volume available to each gas on mixing. Thus, for gas A the available volume has increased from VA to (VA + VB). By calculating the entropy of expansion of each gas we can calculate the entropy of mixing as shown in the panel below.
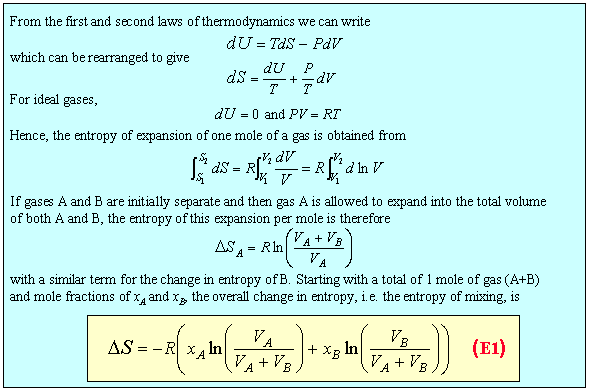
We now give a possible definition of an ideal solution. It is one for which the entropy of mixing is given by the ideal expression and for which the enthalpy of mixing is zero. This immediately leads to the result that the Gibbs free energy of mixing is

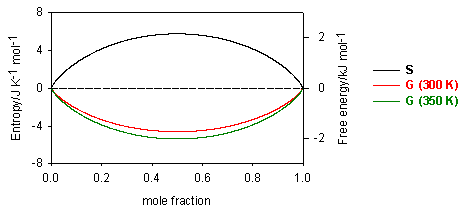
Since mole fractions are always less than unity, the ln terms are always negative, and the entropy of mixing is always positive. Its variation with concentration is shown in the diagram below. For the ideal solution, as defined above, the Gibbs free energy from equation is always negative and becomes more negative as the temperature is increased (see diagram). The decrease in free energy on mixing is always a strong force promoting solubility.
It is interesting to derive the relation between DG and the equilibrium constant K using the above expression for the free energy of mixing. This is not a standard procedure and is not useful except that it does demonstrate very clearly the role of mixing in helping to determine the position of chemical equilibria.
The chemical potential is defined as (a fuller explanation is given elsewhere)

In a two component system the Gibbs free energy contains contributions from the free energies of the two pure substances and from the mixing. The contribution from the pure substance is just G/n where n is the number of moles of substance. The contribution from mixing varies with concentration. This contribution can be obtained in the ideal case by applying equation (M5) to the expression for the free energy of mixing. The result (derivation) gives a contribution to mA of RTlnxA. Because this result combines the two assumptions defining the ideal solution they can be replaced by the single definition of an ideal solution as one for which the chemical potentials of the components are given by

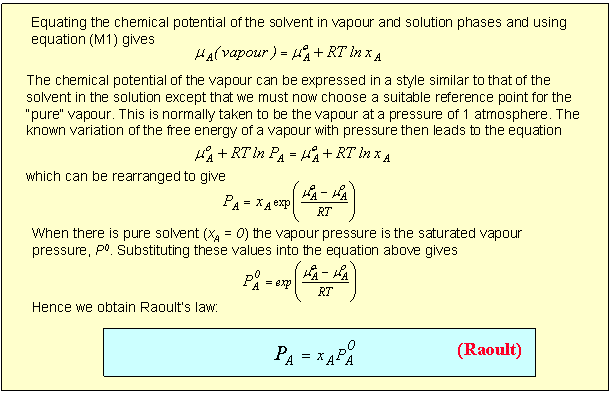
The derivation of Raoult's Law is given in the panel below.
Raoult's Law requires the vapour pressure of the solvent to vary linearly with its mole fraction in the solution. As will be shown below such ideal behaviour over the whole range of mole fraction is rare; for this to happen the two components of the mixture have to be very similar, e.g. a mixture of dibromoethane and dibromopropane.
The applet (adjustable diagram) below can be used to show this type of behaviour ( click here for notes about the use of java applets and click here for other physical chemistry applets). The diagram allows for the interaction between A and B to be varied. In an ideal solution there is no interaction and hence ideal behaviour is obtained by setting the Interaction Parameter to zero. When you do this you will see that the enthalpy of mixing is zero (left hand graph). TΔS and ΔG are also shown on the left hand side. When ΔH is zero the vapour pressures on the right hand side coincide with the ideal (black) values and conform to Raoult's Law over the whole composition range.
The standard examples showing (a) a strong positive deviation from Raoult's Law is acetone/carbon disulphide and (b)showing a stong negative deviation is acetone/chloroform. In the former the strong dispersion forces between the very polarizable sulphur atoms dominate and in the latter a weak hydrogen bond forms between the carbonyl group of acetone and the CH bond of chloroform.
Although Raoult's Law only works over the whole concentration range when the two compounds are almost identical, it generally also works well for the solvent in the region where the concentration of solute is low. This can be seen from the above diagram by varying the interaction parameter. For each component near its saturated vapour pressure Raoult's Law is obeyed satisfactorily, although the concentration range over which it works diminishes as the strength of the interaction is increased (positive or negtive). However, even for relatively weak interactions, Raoult's Law cannot account for the vapour pressure of the minor component of the mixture, i.e. the variation of partial vapour pressure at the low pressure end of the plots. For this region we have to adopt a different strategy. Although this region of the vapour pressure is not accounted for by Raoult's Law the variation of the vapour pressure of the solute is nevertheless linear over a limited range of composition (Henry's Law). Empirically, we can write

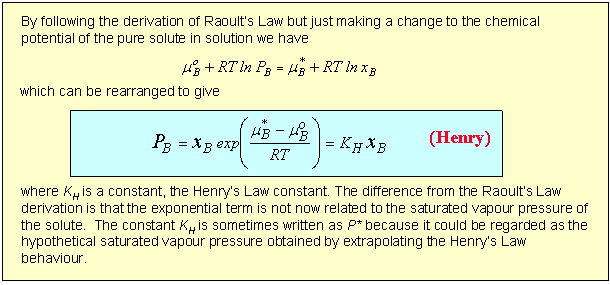
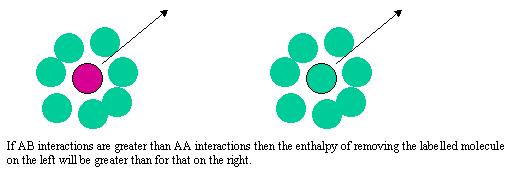
The difference between the Raoult and Henry behaviour can be explained qualitatively by considering what determines the chemical potential as the mole fraction of either A or B tends to zero. The two limiting situations are shown in the diagram below. In Henry's Law the solute molecule is surrounded by solvent molecules at the limit. In Raoult's Law the solvent molecule is surrounded by other solvent molecules. Thus, in Henry's Law it is the strength of the AB interaction (relative to AA and BB) that is significant, but in Raoult's Law it is only the AA interactions (or BB) that affect the behaviour.
When a solid such as iodine is shaken to equilibrium with two immiscible solvents such as toluene and water it will partition between them. At low iodine concentrations an iodine molecule will be surrounded by water molecules in the one solution and toluene in the other. This will almost certainly lead to a difference in the chemical potential of the iodine in the two situations and this should determine the relative solubilities in the two liquids. As shown in the panel below the result is that the ratio of the two solubilities should be independent of overall concentration.
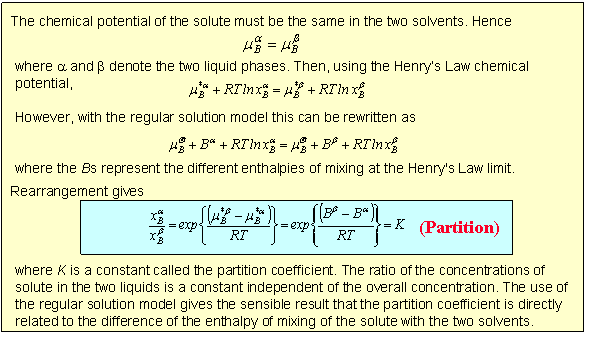
Equation (Partition) offers a straightforward means for determining equilibrium constants that would otherwise be somewhat inaccessible. The equilibrium between I2, I- and I3- in aqueous solution is not easy to measure because during titration to determine the amount of I2 the I3- reverts rapidly back to I2 and I-. If toluene is added and the aqueous/toluene mixture equilibrated then separate titrations on the toluene and aqueous layers give [I2](toluene) and ([I2] + [I3-])(water) respectively. Since the partition coefficient is known (determined in a separate experiment) the true aqueous [I2] can be determined and hence [I3-](aqueous) by subtraction.
For the types of mixtures so far considered the process of solution of a solid solute can be regarded as taking place in two steps. First the solute melts, which will involve a change in enthalpy, and then it dissolves, which is purely an entropic process in the ideal solution model. Because of the change in enthalpy the "ideal" solubility will be temperature dependent and an equation for this is derived in the panel below.
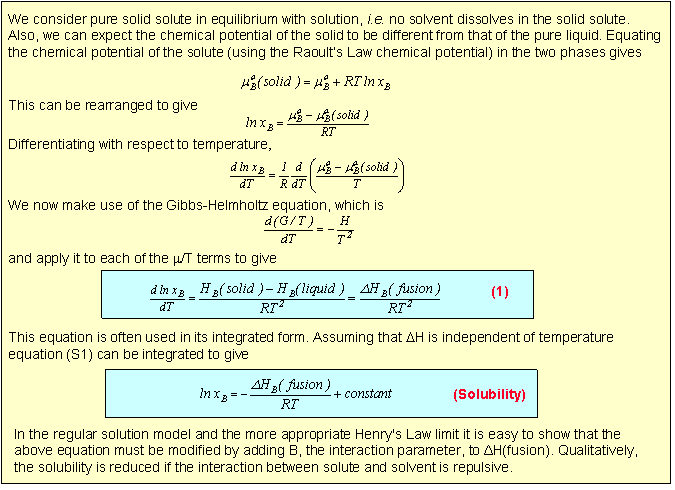
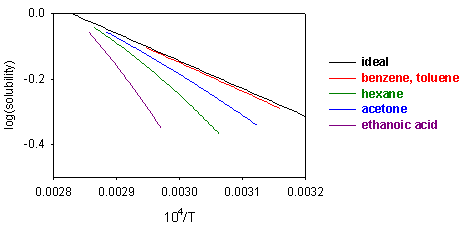
Equation (S1) shows that a plot of ln(solubility) against 1/T should give a straight line with a slope of -DH/T. Results are shown for the dissolution of naphthalene in several solvents below. The solubility of naphthalene is closest to ideal for solvents that are similar to it, e.g. benzene and toluene. There are two effects when the difference between solute and solvent increases; the slope of the plot changes, i.e. the apparent enthalpy of fusion is different, and the plot may become curved. The former results from the additional contribution of B to the enthalpy of fusion. The more repulsive the interaction between solute and solvent, the greater the apparent enthalpy of fusion and the steeper the solubility plot. This is why the slope of the graph is steepest for naphthalene in acetic acid. The curvature in the plot may arise because of deviation from ideality or because the enthalpy of fusion varies with temperature.
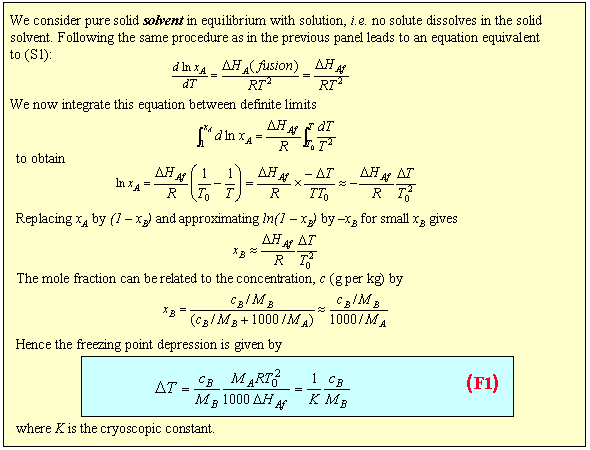
The extent to which a solute depresses the freezing point is quite sensitive to the solvent. For example, DHf is 6 kJ mol-1 for water and 2.5 kJ mol-1 for carbon tetrachloride. Taking into account their molecular weights of 18 and 154 respectively, the freezing point depression in CCl4 is about 17 times that in H2O for a solution of the same molality.
The regular solution model gives a quantitative explanation of the difference in Henry's and Raoult's Laws and is also able to account for much non-ideal behaviour. The model assumes that the entropy of mixing is the same as ideal mixing but that the enthalpy of mixing is not zero. We now examine how a non-zero enthalpy of mixing might depend on concentration. Consider a mixture of A and B where A and B are randomly mixed and the average coordination number is z. If there are NB molecules of B in the mixture these will be in contact with a total of zNB molecules, of which xAzNB contacts are with molecules of A. This is the total number of BA contacts. Before mixing, these contacts would have been BB contacts in pure B and so the change in energy on mixing is, for the B molecules,
xAzNB(εBA − εBB)
By the analogous argument the change in energy on mixing for the A molecules is
xBzNA(εBA − εAA)
and the total energy change on mixing is

where we have also introduced a factor of 1/2 so as not to count all the interaction twice, and we have replaced zN(εAB − εAA − εBB) by β.
We make the approximation that the enthalpy of mixing is the same as the energy of mixing. The non-zero enthalpy (energy) of mixing now leads to an additional term in the chemical potential, μregular, which can be obtained by appling equation (M5) to our enthalpy of mixing.

Hence the chemical potential of a regular solution is

where we have defined a new quantity, the activity coefficient, given by

A similar result is obtained for the activity coefficient of B.
The interaction energy clearly depends on concentration. However, before examining the concentration dependence we can use the model to explain the discrepancies between the limiting cases of Raoult's and Henry's Laws. Designating the solvent as A, xA is approximately 1 at the Raoult's Law limit and xB is approximately 0. Hence BxA2 is approximately 0 and the chemical potential has its ideal value at the limit. Raoult's Law will therefore always approximate to the ideal limit. At the Henry's Law limit the mole fraction of solute, xB is close to zero, xA is about 1 and the enthalpy term becomes approximately B. Thus there is an additional contribution of B to the ideal chemical potential. If the interaction is repulsive B is positive and vice versa. Henry's Law will only conform strictly with ideal behaviour when B is zero.
The purpose of writing the interaction in the activity coefficient form is that the activity coefficient can be combined with the mole fraction to give an equation for the chemical potential that looks the same as for the ideal chemical potential, except with the activity, aA, replacing xA.

This means that, to apply the regular solution model to any of the laws we have derived above, we obtain the equivalent regular solution expressions simply by replacing xA with aA or xAfA. For example, Raoult's law becomes

Experimentally the activity coefficient can be determined simply from the ratio of the measured vapour pressure to the ideal vapour pressure. Since fA is directly related to the interaction parameter β, which is positive for a repulsive energy of mixing and negative for an attractive energy of mixing, we can immediately deduce something about the interactions from the direction of the deviation from ideality.
The applet above calculates the deviations from ideality using the regular solution model. It is capable of explaining a wide range of interactions. It is not always successful, however, one limitation being the enthalpy of mixing is quite often not symmetrical, in experimental systems, although it is so in the regular solution model. Another point to observe is that, when only dispersion forces are operative the energy εAB is less negative than the average of εAA and εBB with the result that B must be positive. This follows from the dependence of the dispersion forces on polarizability:

This is the reason that solutions of heavier species such as sulphur, bromine and iodine in organic solvents almost always show positive deviations. In observing how the vapour pressures respond to changes in the interaction parameter in the adjustable diagram above note that the behaviour becomes somewhat peculiar when the interaction parameter reaches its highest positive values. This is because the repulsion becomes so strong that it leads to phase separation, which will be dealt with below. Before dealing with phase separation we derive another "ideal" solution law, the partition law. Note that, since this uses the Henry's Law limit, it is not really ideal solution behaviour. The result would be trivial and uninteresting if the two solutions conformed to Raoult's Law.
When the interaction parameter β becomes sufficiently large and positive A and B will demix. The regular solution model can be used to predict the pattern of the phase separation of the two partially miscible components.
In the previous section it was suggested that if B becomes sufficiently large and positive A and B will not mix. This is a common situation (water and oil). A qualitative feel for some of the features of phase separation and the roles of the interaction parameter and the temperature can be obtained from a Monte Carlo simulation.
The applet shown below allows you to do your own simulations. It demonstrates mixing on a lattice and, although the model is derived from the Ising model of magnetism, the mathematics is quite lose to the regular solution model. Some suggestions for simulations are outlined below the diagram.
The program above simulates the mixing and demixing of two phases A and B on a square lattice. There are two adjustable parameters, the temperature and the interaction parameter (this is set to be B/2z where B and z are the parameters used in the previous sections). The starting lattice configuration can be chosen to be either the separated phases or the perfectly ordered mixture. The former corresponds to the low temperature limit of strong repulsion between A and B and the latter to the low temperature limit of strong attraction. You can switch between the different starting points by toggling the Reset Button. The method used for the simulation is the Monte Carlo method, which is completely different from that used for the simulation shown in the section on the Radial Distribution Function. The following section in italics, which you do not need to understand, outlines the method. The subsequent paragraph suggests some simulations that you might perform.
An equal number of A and B "atoms" is displayed initially on a square lattice, each atom having four nearest neighbours. one of these, chosen at random, has its identity reversed (B becomes A or vice versa). The resulting change in energy and the corresponding Boltzmann factor (exp(−ΔE/RT)) are computed. If the Boltzmann factor is greater than a random number between 0 and 1 the change is accepted, if not it is rejected (i.e. decreases in energy are automatically accepted, increases in energy are accepted with decreasing probability as they become larger). The procedure is then repeated as long as required. The weighting of the choice of configurations towards those that are energetically more favourable ensures that the system reaches equilibrium much more efficiently than would be achieved with purely random changes. The method is known as the Monte Carlo method and the code used here can be found in Chandler: Introduction to Modern Statistical Mechanics, Oxford, 1987, pp 184-5. Note that periodic boundary conditions are used, as in the simulation shown earlier, to minimize the effects of the boundaries. It may seem from the operation of the program here that multiple changes are being implemented. This is not the case but, since the display is the slow part of the simulation, it is only being updated after every 15 successful moves.
The following are suggestions for some basic simulations.
(i) Start the program with the sliders and buttons in their initial configurations. You see small fluctuations in the "chessboard" configuration confirming that this is the stable low temperature form for strong attractive interactions between A and B (interaction parameter = 2000 kJ/mol).
(ii) Reset the system to start with the separate A and B phases. Start the simulation keeping both sliders in their initial positions (lowest temperature and maximum attraction) and confirm that the system equilibrates to the "chessboard" configuration as expected. However, you will see that it does not reach the perfectly ordered state. It gets locked into a domain structure with one or two defects. This is a good example of frozen in disorder. Each domain is perfectly ordered but there is a mismatch between them and the system would have to pass through a much higher energy state to reconcile this mismatch. You can try to anneal the system by raising and lowering the temperature but it probably will not work.
(iii) Set the interaction parameter to about zero and start the simulation. Since there is no interaction between A and B the equilibrium state is quite quickly established as random mixing, whatever the starting state. Confirm that variation of the temperature has no effect.
(iv) Start the simulation from the "chessboard" configuration with the energy parameter set to maximum attraction and raise the temperature gradually, leaving time at each new temperature for equilibration. The long range order will give way to a situation where there are patches of local order, i.e. there is equilibrium between the ordered "solid compound" phase and a disordered phase. Estimate the temperature at which the solid compound has completely disppeared.
(v) Start the simulation from the phase separated condition with the energy set to maximum repulsion, i.e. slider to the right, but at the lowest temperature. The system remains phase separated, although there are significant fluctuations at the two interfaces. Increase the temperature gradually and observe the amplitude of these fluctuations increase. Can you suggest a reason for the fluctuations? Continue to increase the temperature and estimate the point at which mixing is complete. Then decrease the temperature and test the extent to which you can reverse the process. The phase separation is reversible but it is difficult (not impossible) to recover the initial positioning of the to separated phases. If you try this you will find that it is the periodic boundary conditions that are the main obstacle.
A more quantitative model of the miscibility of two liquids is illustrated in the applet below. On the right is shown the phase diagram of two partially miscible liquids calulated according to the regular solution model. On the left are shown the three thermodynamic parameters. If the interaction parameter has a small positive value, the entropy of mixing ensures that the two liquids mix in more or less all proportions. As the interaction parameter increases so the entropy of mixing is less able to dominate the positive enthalpy of mixing and the free energy of mixing, although remaining negative overall, acquires a shape with two minima and one maximum. In the region between the two minima the free energy of the system is lowest if the system remains as two immiscible solutions with compositions corresponding to the two minima. This is because the free energy of such a phase separated system is represented by a horizontal line tangential to the two minima, whereas the free energy of the fully mixed system would follow the double minimum curve. The compositions of the two immiscible solutions are easily determined by finding the two minima in the free energy of mixing. This method has been used to calculate the phase diagram on the right hand side of the diagram below. As can be tested from the diagram the phase separation region widens as the interaction parameter becomes more repulsive and raising the temperature narrows it. There are some further points of interest. The dynamics of phases separation are driven by fluctuations. In general, if a fluctuation leads to a decrease in the free energy, it will happen spontaneously.In the diagram below there is a region coloured in pink where the variation of ΔG with a composition fluctuation is positive (examine the curvature of ΔG on the left hand side of the diagram). Spontaneous fluctuations in this region do not lead to phase separation. This makes the system metastable. The outer curve on the left then represents the true thermodynamic separation point and the inner curve, called the spinodal represents the end of the metastable region.
The compositions of the two phases in equilibrium in the above diagram and the value of the upper consolute temperature (the temperature at which the two olutions just become miscible) can be obtained by examining the properties of the differentials of the free energy of mixing, as done in the panel below. The compositions of the two immiscible phases are those corresponding to the two minima in ΔG, i.e. where the first derivative is zero and the second derivative is positive. The consolute temperature occurs at a point where both the first and second derivatives are zero, i.e. the plot has no curvature. In practice, the second condition is sufficient for determining the value of TC.
Download regular.jar with RegSolnVPApplet.html and RegSolnMiscApplet.html for these two applets, and ising.jar with IsingApplet.html for the simulation.Phase Diagram for two Partially Miscible Liquids
