Try the following:
(i) With the spectrometer frequency (magnetic field) and zero spin-spin coupling set at their initial values (these can always be obtained by pressing the refresh button on your browser toolbar) vary the chemical shift difference between the two protons (right hand slider). This gives the two line pattern expected for two protons with different chemical shifts but no spin-spin coupling. The energy level diagram on the right shows that each transition is doubly degenerate.
(ii) With the chemical shift difference at a non-zero value, vary the spectrometer frequency (magnetic field). Although, as shown in the energy level diagram the spacing of the energy levels changes in proportion to the field, the spectrum, which is plotted in ppm, does not change (this is one of the advantages of using ppm to plot nmr spectra).
(iii) Set the chemical shift difference to zero and follow the effect of a change in the spin-spin coupling on the energy levels. The effects of the spin-spin coupling on the energies are shown in stages from left to right. Depending on the sign of the coupling levels of like spin move up or down and levels of unlike spin do the opposite. In the penultimate set of levels the states αβ and βα are degenerate when the chemical shift difference is zero and they mix to form symmetric and antisymmetric combinations. The resultant splitting leads to two transitions that are degenerate (in blue) and two forbidden transitions (in red). Even though there is spin-spin splitting, the spectrum has the appearance of a single line.
(iv) With the spin-spin splitting at a non-zero value gradually increase the chemical shift. The mixing of the αβ and βα states is now not as complete because they do not start completely degenerate. Hence the two central lines now no longer coincide and the two "forbidden" outer lines are no longer completely forbidden. This leads to the characteristic appearance of an AB spectrum. The colour of the forbidden lines gives an indication of the degree of forbiddenness as a function of the mixing.
(v) As the chemical shift difference is increased further the αβ and βα states are intrinsically more widely separated and the mixing decreases. The spectrum then starts to resemble the simple doublet doublet structure of an AX spectrum. This can be achieved either by increasing the chemical shift or by increasing the spectrometer frequency. The effects of each can be observed by examining the changes in both the energy level pattern and the spectrum.
(iii) Time dependent effects: the effects of averaging because of chemical exchange, spin-lattice relaxation. The effects of nuclear quadrupoles on the spectra. The proton nmr spectra of NH3 and NH 4+.
The applet below (click here for information concerning applets; the relevant filenames, if you wish to download them, are tutorials/nmr/nmrBroad.jar and tutorials/nmr/nmrBroadAppletJ.html) may help you to understand some of the issues underlying chemical exchange in nmr.
The applet calculates the proton nmr spectrum for a pair of protons with different chemical shifts undergoing exchange at a variable rate. The rate of exchange is assumed to follow the Arrhenius equation and the parameters used are those appropriate to N,N dimethyl nitrosamine (see question 8). The Arrhenius plot is shown in the right hand panel. The left hand panel shows the nmr spectrum and you can use the sliders to vary the spectrometer frequency (equivalent to varying the magnetic field), the temperature, and the separation of the lines. The temperature controls the rate of rotation of the interchanging groups and the position on the Arrhenius plot is marked by the ring in the right hand panel. The spectrum is plotted in terms of the chemical shift in ppm, but it is more convenient to compare the width of the lines in Hz with the jump rate, both of which are displayed in the diagram. The calculation is the standard calculation, shown in several textbooks, and does not include any contribution from the linewidth of the non-exchanging spins. Note also that the formulae for quantitative analysis of the jumping rates differ by factors of two according to different authors' definition of the jumping frequency as the rate of a complete jump cycle or half a jump cycle.
Try the following:
(i) With the spectrometer frequency and line separation set at their initial values vary the temperature and note how the spectrum changes. In particular, verify that the temperature at which the lines just coalesce is 452 K. At this point
jump rate = 21/2π(νA − νB)
Verify that this relationship holds.
(ii) In the slow exchange regime (two distinct lines) set the temperature to a value that gives a line with (Δ) of about 6 Hz and vary the spectrometer frequency. Δ should be approximately constant over the whole range for this value. Adjust the temperature to obtain different values of Δ and verify the approximate independence of Δ as a function of spectrometer frequency (field) except when the lines start to merge significantly. In this regime
jump rate = 2πΔ
(iii) With the spectrometer frequency and line separation set at their initial values adjust the temperature to a point where the lines just coalesce (452 K). Now increase the spectrometer frequency. The lines separate and become more and more separated as the spectrometer frequency increases. This is because the separation of the lines is determined by differences in chemical shift. This difference is plotted in ppm in the spectrum shown, but the frequency of the separation increases linearly with field. Hence it increases relative to the jumping frequency and the averaging effects of the kinetics become less.
(iv) Increase the temperature until only a single broadish line is observed. Note that further increase of the temperature leads to a narrowing of the line eventually to the resolution of the calculation. In the single line regime
Δ = π(νA - νB)2/(jump rate)
Verify that this holds.
(v) Steps (i), (ii) and (iv) give three different means for determining the exchange kinetics. There is a further method that depends on the variation of the separation of the peaks with temperature (or field). Thus, when the kinetics of any exchange process fall within the narrow range required, nmr gives an accurate means of following the kinetic process. (iv) Free induction decay: an outline of the principles and the relationship of the free induction decay and the NMR spectrum.
(v) The esr spectrum of a simple organic radical and the use of the spin-spin
coupling to determine electron densities in aromatic systems. The simplest introductions are Magnetic Resonance by MacLauchlan (Oxford
Chemistry Series) and the OUP Primer by Hore. An older book which has very
good examples in it is Magnetic Resonance by Pople, Schneider & Bernstein. Magnetic Resonance
by Harris covers all the AB, AX stuff in detail, Carrington and MacLachlan,
Principles of Magnetic Resonance is good for those who have done quantum mechanics. Where the question number is enclosed in a button, e.g. , you can obtain help or comments about the question by clicking it. 1. A typical NMR machine operates at a Larmor frequency of 750 MHz for 1H. 2. An NMR spectrometer operating at 100 MHz was used to record
the 1H spectrum of CH
3CHO (acetaldehyde). The frequency difference between the resonances of the
methyl and aldehydic protons is 760 Hz. 3. The nuclear magnetic resonance spectra of samples of methane
gas dissolved in tetrachloromethane are obtained using a spectrometer in which
the 1H resonance frequency is 300 MHz. 4. The nuclear spin energy levels of
the substituted ethene CHX=CDX molecule in a magnetic field are as follows:
Bibliography
Problems
(i) What is the magnetic field strength
in Tesla for such a machine?
(ii) What are the relative populations
of the proton energy levels?

(i) What is the chemical shift difference
in parts per million (ppm) between the two resonances?
The 1
H spectrum of the same molecule was recorded on another spectrometer which
used a magnetic field of 9.396 T.
(ii) On this new spectrometer what is the
frequency difference in Hz, and the chemical shift difference in ppm,
between the two resonances?
(i) Calculate the resonance frequency of 13C
nuclei in the same spectrometer and sketch the appearance of the
13 C and 1H spectra from a naturally
occurring sample of methane, given that the 13C-
1 H coupling constant is 125 Hz.
(ii) Draw the 1H and 2
H(D) spectra from separate samples of 12CH
4, 12CH3
D and 12CD4, and comment
on the spin-spin coupling in the three cases.
[The magnetogyric ratios and spins of 1H,
2D, and 13C nuclei are 26.7519 x
107 rad s-1 T
-1, 4.1066 x 10⁷ rad s
-1 T-1, and 6.7238 x 10
7 rad s-1 T-1
, and 1/2, 1, and 1/2 respectively]
-
mH
mD
frequency/Hz
1
-1/2
-1
+261,457,945
2
-1/2
0
+200,000,000
3
-1/2
+1
+138,542,055
4
+1/2
-1
-138,542,057
5
+1/2
0
-200,000,000
6
+1/2
+1
-261,457,943
You may assume the X atoms, which are cis to each other, to be non-magnetic
and that both carbons are 12C.
(a) Explain the significance of the symbols mH
and mD and state the appropriate NMR selection
rules.
(b) By calculating the frequencies of the allowed transitions determine:
(i) The H-D spin-spin coupling constant,
(ii) γH/γD, the ratio
of the magnetogyric ratios of the two isotopes,
(iii) the strength of the magnetic field in Tesla (γH
= 2.675 x 10⁸T-1s
-1)
(c) Sketch the appearance of the proton and deuterium NMR spectra of CHX=CDX, carefully justifying the relative intensities of the transitions in each spectrum. Which spectrum would you expect to be more intense and why?
(d) If the deuterium atom is replaced with hydrogen, how and why would the proton spectrum differ from that of the original molecule? Estimate the 1H-1H spin-spin coupling constant in the changed molecule.
(e) The one-bond 13C-1 H spin-spin coupling constant in ethene is 167 Hz. The corresponding quantities for ethane and ethyne are 125 and 250 Hz. Comment on these values in the context of the mechanism of the spin-spin coupling.
(f) Sketch the appearance of the 13C NMR spectrum of the molecule 13CHX=12CDX.
The spin Hamiltonian of 12CHF 2Cl (ignoring the fluorine Zeeman interaction, the F-F spin-spin coupling, and the chlorine atom) may be written as
H = − νHÎHz + JHF(ÎHzÎF1z + ÎHzÎF2z)
where νH is the proton Larmor frequency, and
JHF is the H-F spin-spin coupling constant.
IHz, IF1z
and IF2z are the z-components of
the spin angular momentum operators of the proton and the two fluorine nuclei.
Obtain expressions for the energy levels of the HFF spin system and the
frequencies of the allowed transitions in the proton NMR spectrum, and hence
demonstrate that the 1H signal is a triplet.
2-Chloro-5-bromothiophene in CCl4 has the spectrum shown below.
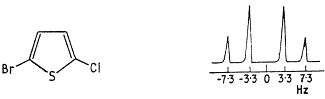
(ii) How would the appearance change when recorded in an NMR spectrometer of higher field?
(a) Sketch the multiplet structure expected in the NMR spectra of the following species (i) 13C in 13 CDCl3, (ii) 1H in 12CHD2Br.
(b) Explain why the NMR lines of 13C atoms bonded to the halogen atoms Cl, Br, and I are affected in frequency but not split by spin-spin coupling, although all common isotopes of these halogens have non-zero nuclear spin.
(c) Sketch the multiplet structure expected in the 1H spectrum of the NH4+ ion in solution. Why is there splitting for this ion but no corresponding splitting is observed in the spectrum of the methylammonium ion, CH3NH3+?
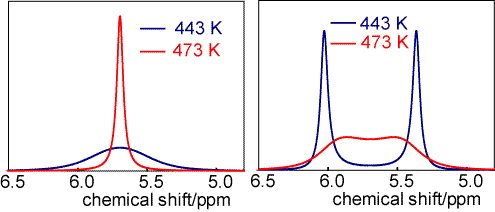
The spectra below are of nitroso dimethylamine ((CH3)2NNO) at two different temperatures and two different spectrometers. On the left the proton resonance frequency of the spectrometer is 40 MHz and on the right it is 400 MHz. The separation of the two lines in the 400 MHz spectrum is 0.67 ppm and on the left the line widths are 0.50 ppm at 443 K and 0.06 ppm at 473 K. Give a full discussion of the behaviour in the four different circumstances and estimate the barrier to internal rotation.

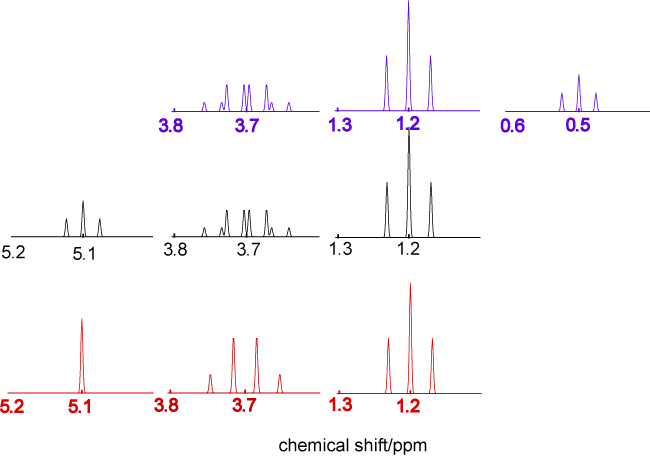
The NMR spectra below are all of ethanol. The top spectrum in blue is ethanol in the vapour phase or very dilute in dry CCl4, the middle spectrum in black is pure dry liquid ethanol, and the spectrum in red is of liquid ethanol containing a very small amount of HCl. Account for the differences between the three spectra in as much detail as you can.
Predict and explain the appearance of the electron spin resonance spectrum of the 12CH3methyl radical. In this planar radical, and others like it, the hyperfine coupling constant is directly proportional to the unpaired electron spin density in the p-orbital on the carbon atom. If the observed coupling in 12CH3 is 64.5 MHz, predict the spectrum of the benzene negative ion 12 C6 H6- in solution, giving a full discussion of the number of hyperfine componenets, their relative intensities and separations.
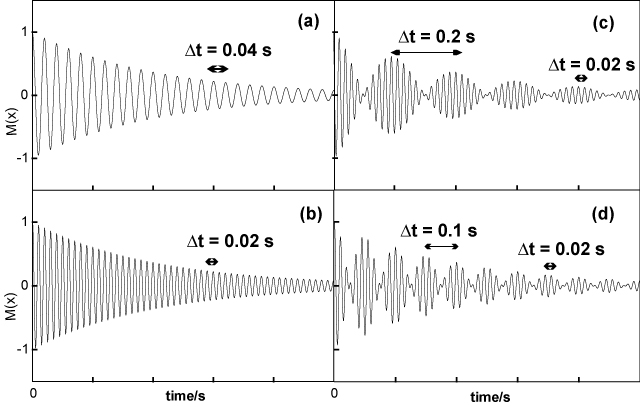
(a) Explain in detail the principles of the measurement of a free induction decay and how it is related to the NMR spectrum.
(b) The figure below shows four free induction decays. Two of them correspond to an NMR spectrum with a single line and two of them correspond to spectra with two lines of equal intensity.
(i) Identify which spectrum is which,
(ii) Determine the separation (in frequency) of the centre of gravity of each of the four spectra from the exciting line,
(iii) Determine the splitting (in frequency) of each of the two line spectra.