Water soluble polymers are often included in commercial surfactant formulations. They modify both the surface behaviour and the rheology of the bulk solution. These effects may become very large when the polymer/surfactant interaction is sufficiently strong. The most common pattern of behaviour for uncharged polymers and surfactants is for the surfactant to form micelles on the polymer chain at a concentration below the critical micelle concentration of the surfactant on its own. This changes the conformation of the polymer chain in solution, by a large amount if the surfactant is charged because it endows the polymer with polyelectrolyte qualities. This alone will cause major changes to the rheological properties. The surfactant micelles may also cross-link the polymer molecules and the resulting gel-like structure makes the solution very viscous. The aggregation in the bulk solution has been relatively well studied by various techniques, including small angle neutron scattering. However, the behaviour of polymer/surfactant mixtures at interfaces has hardly been studied mainly because of a lack of experimental techniques.
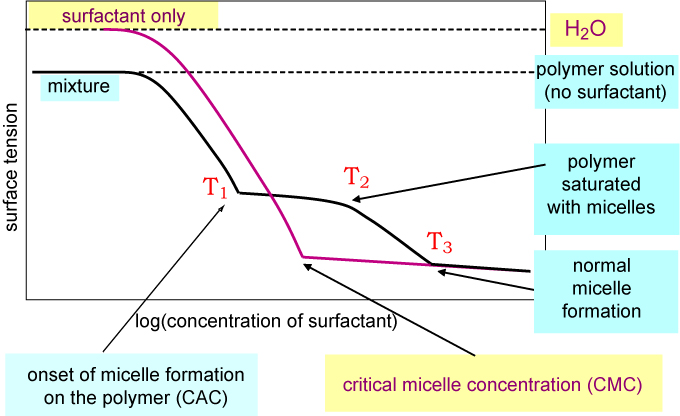
One way of following the interaction of a polymer with surfactant in the bulk solution is to measure the surface tension of the mixture, keeping the polymer concentration constant and varying the surfactant concentration. For a weakly interacting system the pattern of behaviour is as in the figure below. There is a break in the surface tension at a concentration below the normal CMC (T1), associated with the critical aggregation concentration (CAC), which corresponds to the onset of micelle formation on the polymer. As more surfactant is added the polymer becomes saturated with surfactant micelles (T2) and then the monomer surfactant concentration starts to rise again. This causes the surface tension to drop below the plateau region in the figure until the monomer surfactant concentration is high enough for it to form free micelles (T3).
Although surface tension is a property of the surface, its main use for studying polymer/surfactant mixtures has been to elucidate what is happening in the bulk. The advent of neutron reflection, however, now offers the opportunity to interpret the surface tension behaviour in terms of the composition of the surface. As described in Neutron Reflection separate deuterium labelling of polymer and surfactant can be used to determine the surface excess of each component.The figure below shows the surface tension behaviour of a 0.1 wt% solution of poly(ethylene oxide)(PEO) in water as the concentration of sodium dodecyl sulphate (SDS) is varied. The surface tension approximately conforms to the pattern shown in the previous idealized diagram except that the two breaks in the surface tension, the CAC and CMC, do not have an intervening plateau. The surface excesses of each component vary most rapidly in the region shaded in grey, where the SDS displaces the PEO from the surface. At the CAC there is negligible PEO left on the surface. However, it should not be concluded that the PEO and SDS do not interact at the surface. Quantitative fitting of the behaviour of the surface tension and surface excess in the grey shaded area shows that there is an attractive interaction between polymer and surfactant of a magnitude similar to that between SDS and a non-ionic CnEm surfactant (E signifies an ethylene oxide group).
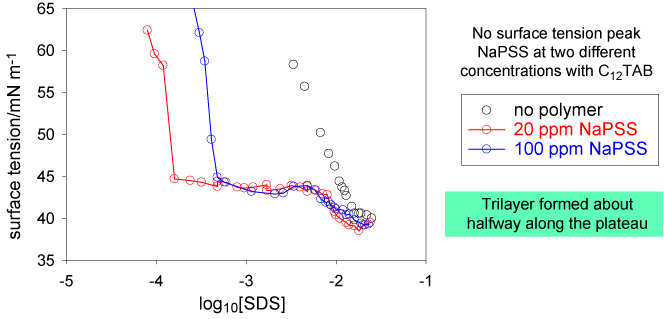
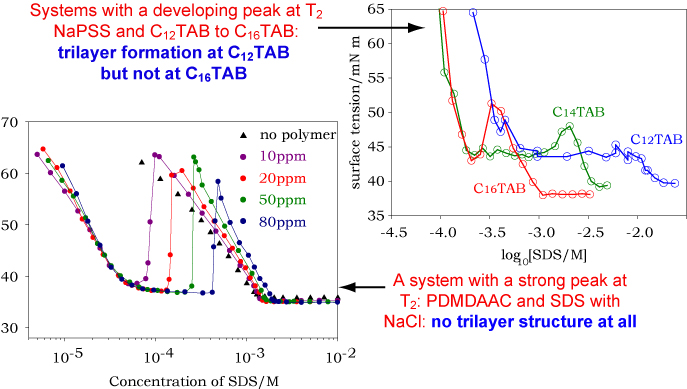
The appearance of the surface tension curve when there is a weak interaction between polymer and surfactant, as in the example above, is dominated by what is happening in the bulk solution. This is not the case when the interaction is much stronger as for polyelectrolyte/surfactant interactions when they are of opposite charge. The surface tension curves for such mixtures fall broadly into two categories and examples of each are shown below. The first resembles the surface tension diagram shown above but, as we show later, this is only a superficial resemblance. The second is completely different and shows a marked peak half way along the plateau.
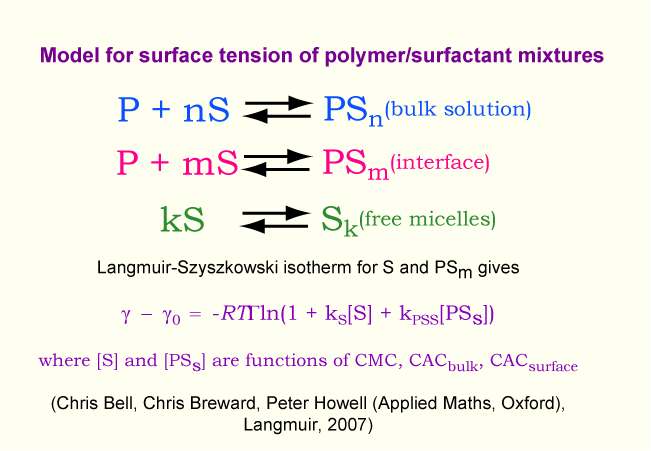
These observations suggest that these systems form a well-defined surface complex (or two of them) in addition to the common bulk solution polymer-micelle complex. This idea has been turned into a quantitative model by the Department of Applied Maths (Oxford). This uses the law of mass action in conjunction with the Langmuir isotherm for the adsorption of surfactant and of the polymer-surfactant complex and the assumption of a defined stoichiometry fo the two complexes. The Gibbs prefactor for the polymer-surfactant complex is taken to be the number of bound surfactant molecules. The equations and the result are set out below.
The applet below shows how this model accounts approximately for the two types of behaviour. The three most important parameters to vary on the right hand side of the applet are the three values of the CMC/CAC for the bulk complex, the surface complex and the normal surfactant micelles. To fit the curve fully it is also necessary to adjust the two limiting surface tensions of the surfactant alone and of the polymer-surfactant complex. Finally, actual data can be included by pressing the "change data" button. The behaviour of the curve reflects the competition between the two processes of surface and bulk complexation. Set the surface CAC to a low value (high stability). Then vary the bulk CAC. Above a certain value the peak in the surface tension vanishes and the high concentration limit of the surface tension is that of the surface complex, which is too stable to be destroyed by bulk complexation. When the bulk CAC is lowered below that of the surface complex the surface tension just follows that of the pure surfactant; the bulk complex is simply not formed. Fit the data (NaPSS + C12TAB with added electrolyte). Note that the value of the bulk CAC does not correspond to any of the discontinuities, showing that it is not correct to deduce the CAC in the manner that is used for uncharged polymer-surfactant interactions.
See also Surfactant mixtures, Neutron Reflection.