We examine ways of modelling and exploring experimentally (surface tension and neutron reflectometry) the surface behaviour and micellization of mixtures of surfactants. Three interactive simulations in the form of Java applets allow you to vary different parameters and to observe how the surface tension and composition of such mixtures depends on the intermolecular interactions and the intrinsic surface properties of the components.
Surfactant formulations used in household and commercial applications are generally blends of surfactants. Each "surfactant" may itself be a mixture of, for example, different chain length materials but a "blend" here means a mixture of two distinct surfactants carefully selected to optimize the performance of the mixture. There are many examples of binary mixtures of surfactants where the interaction between the two surfactants produces surface properties quite different from that of the starting materials and many of these mixtures have commercial value (see, for example, commercial formulations). The successful use of such mixtures in commercial formulations relies on taking advantage of these interactions, which may be cooperative (synergistic) or antagonistic. Unfortunately, the prediction of the properties of strongly interacting systems, which are the most important in applications, is not easy. To appreciate the difficulty of predicting the surface properties it must be realised that the surface composition, which is what determines the surface behaviour, may be very different from the bulk composition, and that the interactions between the surfactant molecules at the interface are bound to be large because they are closely spaced.
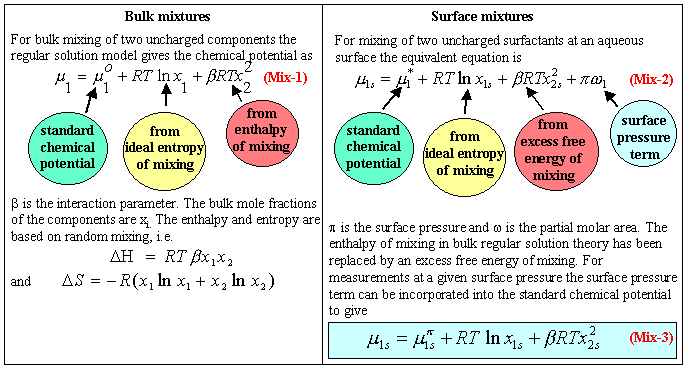
A widely used model is based on the regular solution model for bulk solutions. The main features of the regular solution theory (RST) of bulk liquid mixtures are that it assumes that the entropy of mixing is ideal and that there is an enthalpy of mixing which depends on the composition of the mixture (see a fuller description at undergraduate level). The chemical potential for each component is then as defined in equation (Mix-1) in the panel below. The main complication of extending this model to the air/water interface is that the additional variable of surface pressure contributes to the chemical potential. Otherwise the differences from the bulk regular solution model are (i) that it is not necessary to assume that the interaction term arises from enthalpy alone and (ii) that the standard chemical potential is not as easily defined. A simplified treatment incorporates the surface pressure term into the standard chemical potential (equation (Mix-3)). An equation similar to the simplified form shown in this panel can be written for micellar aggregates.

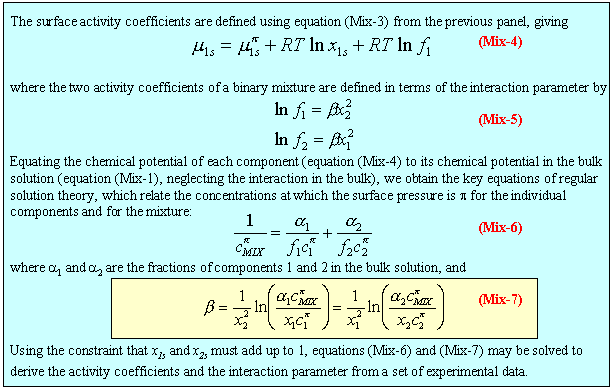
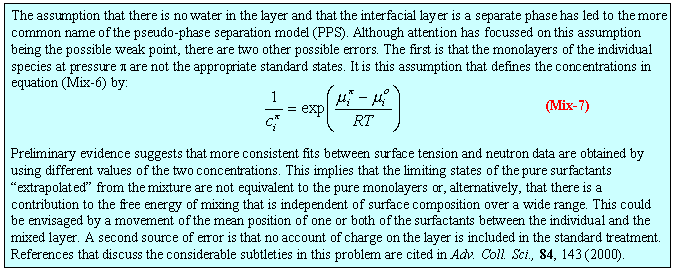
Iterative solution of equation (Mix-7) from the concentrations of solutions of pure A, pure B and a mixture of specified composition at a particular surface tension gives the interaction parameter Β and the composition of the surface. Alternatively, for mixing in a micelle, the same calculation is done using CMCs instead of concentrations. The two Β values are not necessarily the same and it should also be noted that there are other ways of doing the calculation. The two given here are the simplest. The applet below does this calculation over a wide range of values of composition, concentration and Β parameters. These effects can be explored using the applet displayed below (click here for information concerning applets; the relevant filenames, if you wish to download them, are topics/mixing/mixing.jar and topics/mixing/MixingAppletJ.html).
Description of calculation: For convenience, the isotherms for A and B, shown on the left hand side of the diagram, are taken to be simple Langmuir isotherms. The affinity of the two surfactants for the air/water interface is taken to be inversely proportional to their CMCs and the surface tension above the CMC is assumed to be constant. The surface tension for the mixture is calculated iteratively at the chosen composition using equation (Mix-7) at fixed surface tensions and the mixed CMC is calculated similarly. The right hand side of the diagram shows the variation of surface composition with bulk composition at the chosen ionteraction parameter and at a fixed surface tension. The ringed point in the right hand part of the diagram indicates the chosen bulk composition for which the surface tension curve for the mixture on the left has been calculated. The ringed points on the surface tension curves of A and B are those used to calculate the corresponding point on the mixed surface tension curve.
The following are suggested variations to try.
(i) Making the interaction parameter strongly negative makes the surface tension of the mixture very much lower than either of the pure components. This is typically what most commercial formulations are aiming for. By making the interaction parameter positive you can also make the surface tension higher than the two pure solutions (just!).
(ii) Set the interaction parameter to zero, i.e. ideal surface mixing. At this point the surface composition can be seen to be mainly dependent on the activity of the two components, as measured by their CMC (note that the CMCs here have been chosen to determine the surface activity). A high ratio of CMCA/CMCB means that B is very much more surface active and hence dominates the surface composition.
(iii) Set the interaction parameter reasonably negative then vary the composition. There is a point where the mixed surface tension shows maximum synergy. This is determined by a balance between the strong attractive interaction between the two surfactants and their intrinsic surface activity.
(iv) When the interaction parameter is strongly negative the surface composition varies relatively weakly with bulk composition over much of the composition range. The opposite behaviour occurs when Β is positive. This is easily rationalised in terms of A and B wanting to be together on the surface when they interact favourably and trying to stay apart when the interaction is repulsive.
(v) In the situation where the interaction is strongly synergistic the surface composition is not only relatively flat over much of the bulk composition range, but it adopts a level that is determined by the relative surface activity of the two components.
(vi) Finally, you can repeat all of these calculations for the mixed micelles, by pressing the button at the bottom of the applet.
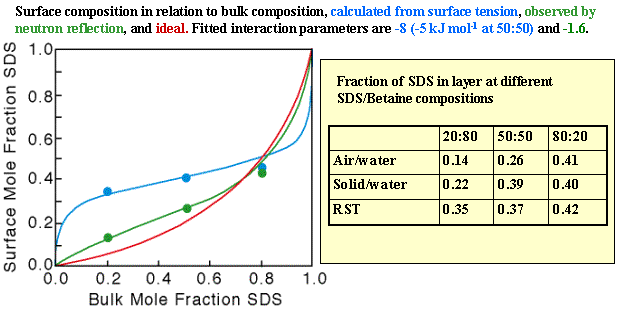
The strong synergy that often arises in surfactant mixtures is illustrated by the example of SDS and C12Betaine in the figure below. Using conventional measurements (surface tension) the only indication that can be obtained that RST is not working is if a single value of b does not fit the data over the whole composition range. A more severe test of the model is to fit a b parameter to the surface tension, use this to calculate the composition of the surface (from equation (Mix-7)), and to compare the result with an independent measure of the surface composition.
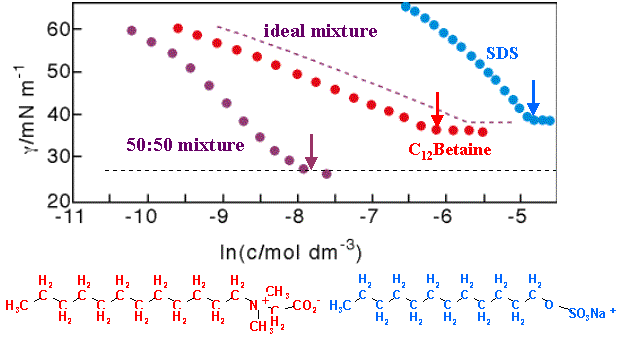
Although it is possible to use surface tension measurements to determine the individual surface excesses in a mixed surfactant layer via the Gibbs equation, the measurement is much more easily and accurately performed by neutron reflection, using isotopic labelling as discussed in Neutron Reflection. When this is done for the SDS/C12Betaine system the results totally disagree with the RST prediction, as shown in the figure below. The disagreement can be expressed in two ways; either by a simple comparison of the compositions calculated from surface tension with those measured by neutron reflection, or by using the compositions to calculate the interaction parameter and comparing this interaction parameter with that determined from surface tension. The disagreement is large either way. For example, the value of b from the neutron coverages is much less (in magnitude) than from the surface tension, the neutron results indicating a weak interaction whereas surface tension indicates an unusually strong interaction. The table below shows the interesting reult that the compositions calculated from surface tension for the air/water interface are much closer to those observed at the hydrophobic solid/water interface, although the theory is not appropriate for this interface.
A number of similar discrepancies have now been observed, although none is so large as the one for SDS/C12Betaine system. We do not know the reasons yet, but there are several points at which the RST treatment is suspect. In deriving equation (Mix-4) in panel 2 we implicitly assumed that the surface is a binary mixture of two surfactants, whereas it is actually a ternary mixture of the two surfactants and water. This means that the expressions for the activity coefficients, equation (Mix-5), are not correct.
On the basis of the small number of systems that have been investigated by neutron reflection it seems that the largest discrepancies occur for systems where there are marked structural differences between the individual and the mixed layer.
The above discussion has centred on concentrations below the CMC. It has often been assumed that above the CMC the composition of the surface and the micelles rapidly approaches that of the bulk. This is not at all the case and a number of surprising things occur, which are illustrated in another applet shown below. This uses the same methods as the first applet except that above the CMC the iteration is slightly more complicated. The interation at the CMC is the same as before and that is reflected in the fact that the left hand half of the diagram is unchanged from the micellar calculation already shown above. (For those who wish to download the applet the relevant filenames are topics/mixingCMC/mixingCMC.jar and topics/mixingCMC/MixingAppletJ.html).
(i) The right hand side of the diagram initially plots variation of the composition of the micelles as a function of log of the bulk concentration. The mixed CMC is shown as the green line and the mixed CMC for the particular composition is ringed in black. The bulk composition can be varied by the central slider. Below the CMC the composition of the monomers has to be the same as the bulk and the lines showing the composition in this part of the diagram are therefore vertical. The micellar composition is represented by the red and blue lines at compositions above the CMC. At large concentrations the surfactant is mainly in the form of micelles and must therefore tend to the bulk value, i.e. the same limits as at concentrations below the CMC. Test this by varying the composition.
(ii) There is one composition when the bulk monomer composition and the micellar composition remain the same over the whole concentration range. This is at the composition at which the CMC has its minimum value. At other compositions the system has to reach a compromise between adopting the most favourable micellar composition at the minimum CMC and conforming to the bulk composition. Just above the CMC this will cause the micellar composition to lie between the bulk value and the optimum value. If the bulk value coincides with the optimum value the composition remains constant over the whole concentration range.
(iii) Click the button at the bottom of the applet to switch to the monomer composition. At high concentrations the composition is determined by the micellar composition but the monomer composition has almost no effect and hence does not need to conform to the bulk stoichiometry. This has the interesting consequence that, at a mole fraction (A) of 0.5 and at high concentrations, the mole fraction of monomer A is a long way from 0.5. By varying the CMC ratio you will see that the monomer concentration of the more surface active species is always lower at this particular mole fraction. This reflects the fact that a lower chemical potential of the more surface active component is required to make a micelle of mole fraction 0.5 than of the less surface active component. Chemical potential is approximately proportional to log(monomer concentration).
(iv) The only point where the monomer concentration is constant over the whole concentration range is at the composition where the CMC is a minimum.
(v) If the micellar solution is in contact with any surface (air/water or solid/liquid) adsorption at this surface will depend on the chemical potential, i.e. the monomer concentration. The applet shows that this may bear quite a complex relation to the bulk composition and bulk concentration. The applet shows only the composition variation of the monomers above the CMC. However, the variation of the CMC itself adds a further factor to the bulk monomer concentration. This can be seen in a third applet below, which now shows on the right hand side the variation of monomer concentration with overall concentration. (For those who wish to download the applet the relevant filenames are topics/mixingHPhil/mixingHPhil.jar and topics/mixingHPhil/MixingAppletJ.html).
In this third applet the left hand side is the same as before. On the right hand side are shown the monomer concentrations of the two surfactants (red and blue) and the total surfactant concentration (purple). The monomer concentration is scaled for convenience to the CMC of A, which is fixed throughout the calculations. The occasional bumps seen on the right hand side of the diagram reflect the build up of errors as the results of iterative solutions are themselves used for further iterations.
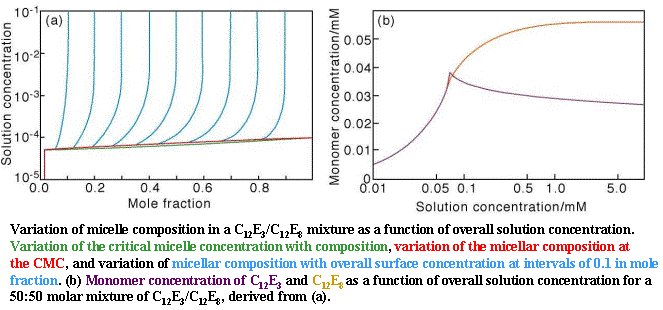
The behaviour of the monomer concentration in the two applets above dominates adsorption from mixtures above their mixed CMC but it has not yet been significantly explored in these terms. Some aspects of the behaviour illustrated in the second applet have now been observed by neutron reflection (and neutron small angle scattering for micellar composition). Measurement of composition of the surface in this region of concentration is only possible with neutron reflection. A simple example is the binary mixture of surfactants, C12E3 and C12E8, which mix ideally (the b parameter is zero) but C12E3 is the more surface active of the two. Just below the CMC the C12E3 is the major component of the surface. However, just above the CMC it becomes the major component of the micelles and this causes the amount of monomer C12E3 in the solution to drop below the value it had just below the CMC and this leads to a discontinuity in the monomer concentration (see the right hand side of the figure below). Since the adsorption at the air/liquid surface depends on the monomer concentration, the proportion of C12E3 in the monolayer also shows a discontinuity. The overall behaviour of the CMC and the composition of the micelles in shown on the left hand side of the figure with the special case of the 50:50 mixture on the right. This behaviour was originally predicted by Blankschtein at MIT who uses a more fundamental approach than RST and it has been verified with neutron reflection (see Jeff Penfold http://www.isis.rl.ac.uk/science/index.htm). See also Polymer/Surfactant mixtures, Neutron Reflection.