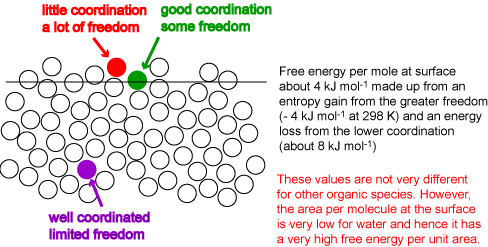
At the surface of a liquid the coordination of a molecule is reduced. The creation of a surface therefore requires an input of energy. The situation is complicated by two factors. First, a molecule at the surface also gains entropy from its greater freedom of movement and hence the surface free energy, which is what is most easily measured (see below), is very different from the surface energy. Secondly, the surface energy is measured per unit area, not per mole. We neglect the second problem for the moment by focussing on the surface energy per mole (or molecule). The surface layer of molecules will adjust their coordination to optimize the gain in entropy and the loss in energy. The result is somewhat like the surface on the right of the diagram below. This has an average layer intermediate in density between bulk and vapour, and the coordination of a molecule in this surface layer is much less than half its value in the bulk. However, the remaining molecules on the surface, the majority, remain extensively coordinated, i.e. the average coordination remains quite high. The perfect surface on the left is physically unrealistic because it does not allow for thermal fluctuation (alternatively, it unrealistically restricts the possible gains in entropy resulting from a more disordered surface). The large amplitude thermal fluctuations of a surface can be seen in the mixing simulation shown earlier in the lecture course and reshown below. Set the interaction energy to its most positive value (corresponding to phase separation) and use the reset button to obtain the separated phases, then start. Even at the lowest temperature the interfacial fluctuations are very large. Values of the energy per mole at a surface indicate that the level of coordination drops by between a third and a quarter of what it is in the bulk, i.e. to 8 or 9 atoms, compared with 12 in the bulk, i.e. the surface energy per mole is between one third and one quarter of the energy of vaporization. The surface energy per unit area, which is what can be determined experimentally, is obtained by dividing the energy per mole by the area per mole (molecule). This varies much more dramatically from molecule to molecule. For example, benzene and octane have higher surface energies per mole than water but their much greater sizes result in surface energies per unit area that are less than half that of water. The surface free energies of benzene, octane and water at room temperature are respectively 29, 22 and 72 mJ m-2. The energy required to create a given area of water surface is more than three times higher for water than for octane.

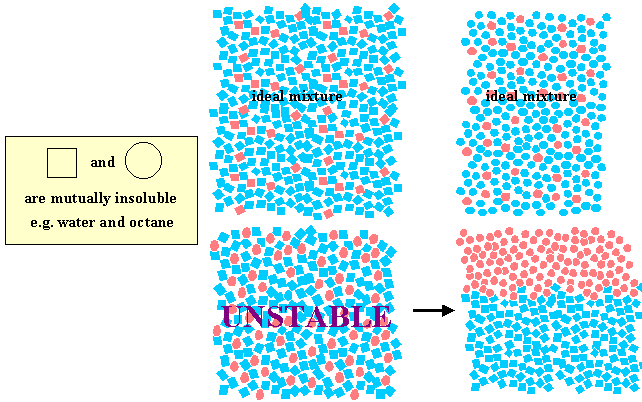
We can represent the situation a bit more clearly by drawing two immiscible species, squares and circles, as in the diagram below. All squares are miscible with each other, whatever the colour, but suqares do not mix with circles, similarly for circles.
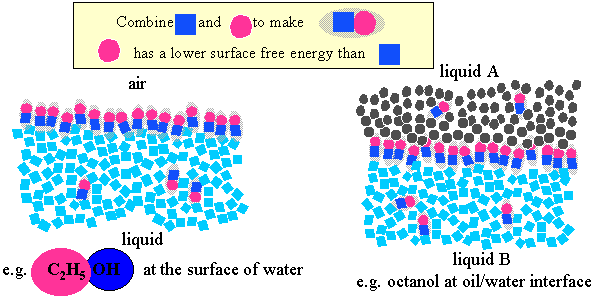
Amphiphilic behaviour can be generated by joining two chemical groupings with opposite solubility characteristics (e.g. the red and the black groupings in the simulation above. Ethanol is a simple and is indeed amphiphilic. Amphi means both and the name amphiphile follows because the OH group is hydrophilic (likes water) and the CH3 group is hydrophobic (does not like water). An amphiphile will attempt to remove its hydrophobic part from the aqueous environment while keeping its hydrophilic part in water. One way it can achieve this is by self-aggregation, e.g. the molecules can align themselves to form aggregates with the hydrophobic tails pointing inwards. However, owing to the relatively large surface free energy of water it is also highly favourable for amphiphiles to congregate at the surface of water (air/water interface) or, if both oil and water phases are present, at the surface formed by the boundary between them (oil/water interface).
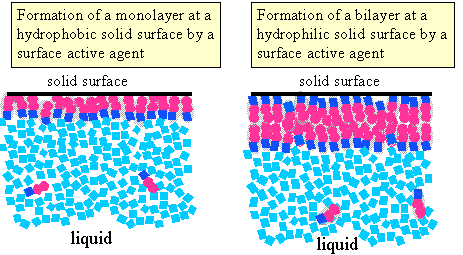
Depending on the characteristics of a solid surface in contact with water and on those of the amphiphile the amphiphile could adsorb at the solid/liquid interface in different ways, two of which are illustrated alongside. |
|
|
If both hydrophobicity and hydrophilicity are increased the surface activity illustrated in the figure above is intensified to a point where self-assembly of the molecules may occur within the solution. Two types of self-assembly are shown schematically in the figure below, the formation of micelles and the formation of microemulsion droplets, where oil is solubilized into the interior of a micelle. |
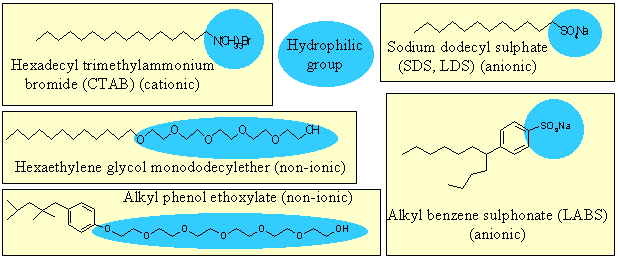
Real amphiphiles may be designed to be soluble or insoluble in water by adjusting the magnitude and/or balance between hydrophobicity and hydrophilicity. The lecture course will distinguish between these two types as insoluble amphiphiles and soluble materials, often referred to as surfactants. For now we consider surfactants only, of which some examples are shown below. In each example the hydrophilic part of the molecule is marked and the remainder of the molecular skeleton is saturated hydrocarbon. Further examples of surfactant structures and examples of products that either consist of or rely on surfactants can be found in the research part of the website (Examples and Products) where there is also a further discussion on Surfactants
.
That soluble amphiphilic molecules self-assemble into aggregates in solution can be demonstrated experimentally in many ways. Measurement of almost any physical property of the solution shows a discontinuity in the physical property at a particular concentration, which is characteristic of the compound being examined at the chosen temperature. The discontinuity is usually associated with the formation of micelles and is known as the critical micelle concentration (CMC). Useful physical quantities for detecting the CMC are conductivity, surface tension and fluorescence of a chromophore added to the solution, some of which are shown in the figure alongside. For commonly used surfactants the CMC is typically less than about 0.01 M (e.g. sodium dodecyl sulphate: 0.008 M). |
|
The experimental evidence for the shape and size of the aggregates that are formed is less easy to obtain. The aggregates are too small to be directly observable by light scattering (that is why the solutions usually appear quite clear). The most direct method is by x-ray or neutron scattering (discussed under Polymers). A typical micelle has a radius about equal to the fully extended length of the chain of the surfactant molecule, i.e. about 20 Å, and contains of the order of 100 molecules. Theoretical estimates of shape and size can be made with the following model.
The loss of entropy in binding surfactant molecules into a single unit (the micelle) will always ensure that the aggregate is as small as possible consistent with the geometry permitted by equations (Sh-1), (Sh-2) and (Sh-3). When the molecules satisfy the condition of equation (Sh-1) they also satisfy the conditions of equations (Sh-2) and (Sh-3). However, maximization of the entropy then ensures that spherical micelles are the preferred option. The awkward geometry of spherical micelles is such that the space can only be filled efficiently (as required by nature) if the core of the micelles is fluid-like. |
|
It is useful to be able to assess to what extent the nature of the aggregates can be manipulated by changing the molecular geometry. There are three easily manipulated factors, (i) the design of the initial molecule, i.e. choosing values of v, a, and l, (ii) varying a using the external conditions, e.g. adding electrolyte to reduce electrostatic repulsion between the head groups, (iii) by adding a third component. Addition of electrolyte to a solution of a charged electrolyte above its CMC always acts to reduce a and hence induce spherical micelles to become rod-like. This behaviour is easily followed because rods get entangled with each other and the solution goes very viscous. It is this effect of added electrolyte that is the dominant factor in the idealised sequence of phases shown by a surfactant solution as the concentration of surfactant is increased. |
|
The addition of a third component can be used in two ways. If a non-polar material is added it will prefer to occupy the interior of the micelle and, if it is fluid, it will assist the packing of the ends of the surfactant chain. It will therefore be incorporated into the micelle (solubilization) and this is one of the factors that contributes to detergent action. However, there is a limit to how much material can be solubilised because swelling of the micelle will cause the surface of the micelle to be defective and hence allow water to come into contact with the interior. The maximum size of particle that is thermodynamically stable is achieved by modifying the surfactant layer by increasing v/al, either by changing the structure of the surfactant molecule or by adding a co-surfactant (examples will be given in the lecture). The maximum size in a thermodynamically stable system is a radius of about 5 nm. Such solutions are called microemulsions. Ordinary emulsions, which have much larger particle sizes, are not thermodynamically stable.
Ordinary emulsions are of widespread occurrence, e.g. milk, mayonnaise, many sauces, cosmetics, etc. There are two main factors determining their stability. The first is that there must be some mechanism for preventing the particles coalescing (in principle this could be by means of charge stabilisation (see Molecular Interactions-1) but in practice it is usually steric stabilisation by means of a polymer). The second is that the surface active agent at the oil water interface of the particles should promote the desired form of curvature, i.e. oil particles in water or water particles in oil. This will be discussed in the lecture in relation to making mayonnaise reliably.
The CMC can usefully be thought of as a kind of limiting solubility. To estimate the solubility, and hence the CMC, we adapt the theory of regular solutions (see Molecular Interactions-1) as in panel 2.
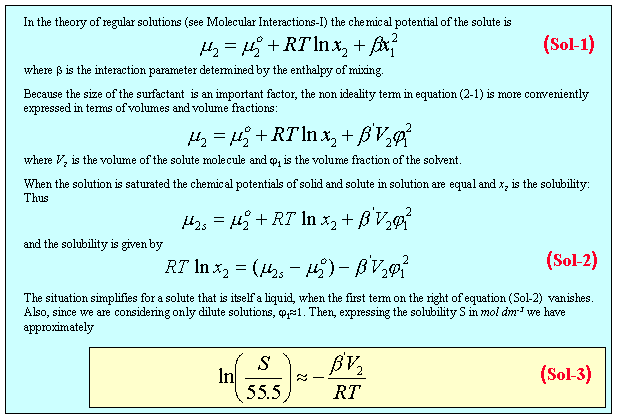
Applying equation (Sol-3) to the series of hexaethylene glycol monoalkylethers with the alkyl chain length varying from 6 to 16 carbon atoms (see previous diagram of different surfactants) gives the results shown in the figure below. If the relevant volume is taken to be just the hydrophobic fragment the data are fitted extremely well with a single value of b, but they are not accounted for at all if the volume of the whole surfactant is used for the calculation.

| At low temperatures a saturated surfactant solution will be in equilibrium with solid surfactant; the temperature is too low for micelles to form and the limiting solubility will be low. At the so-called Krafft temperature it becomes possible to form micelles and the surfactant becomes much more soluble; there is a break in the solubility curve, as shown for sodium decylsulphonate alongside. |
|
Whereas the CMC is primarily determined by the hydrophobic group, the Krafft temperature depends strongly on the nature of the head group and the length of the hydrocarbon chain. The hydrocarbon fragments have to be in a liquid state for micelle formation to occur. Solidification of the hydrocarbon chain is favoured by the cohesion between hydrocarbon chains, which increases with their length. Thus, the Krafft temperature increases with chain length, as shown for the Krafft temperatures of the sulphonates in the Table below.
| C10SO3Na | C12SO3Na | C14SO3Na | C16SO3Na | C18SO3Na |
| 22oC | 34oC | 43oC | 52oC | 60oC |
Solidification can, however, be hindered if the hydrophilic head group is large enough to prevent too close an approach of the hydrocarbon chains. The cross section of a typical hydrocarbon chain is about 0.22 nm2. For a typical micelle the head group area must be greater than about 0.50 nm2. A head group of cross section much less than about 0.50 nm2 will tend to stabilize the solid hydrate, i.e. raise the Krafft temperature. The effect of the size of the head group can be seen for the three compounds in the Table below.
| C16SO4Na | C16SO3Na | C16N(CH3)3Br |
| 38oC | 52oC | 26oC |
If the hydrophobic part of an amphiphile is sufficiently dominant the compound will be insoluble in water. Typically, this can be achieved by increasing the hydrocarbon chain length to C20. When a drop of such a species is placed on the surface of water the effect of the hydrophilic group will be to make it spread on the surface to form a molecular monolayer. Note that a compound without a hydrophilic group, such as a simple hydrocarbon, will tend to remain as droplets on the surface.
The favourable interaction of the hydrophilic group of an amphiphile spread on the surface of the water lowers the energy lost as broken hydrogen bonds and hence lowers the surface energy of the system. In the Figure below an amphiphile has been spread on the surface of water on the right hand side of a barrier that separates the covered water surface from clean water on the left hand side of the barrier. The free energy per unit area, designated γ, is higher for water than for the spread monolayer. Since the system will act to reduce its free energy, there will be a pressure (the spreading pressure) acting to move the barrier to the left, which depends on the difference in the two free energies per unit area. The argument below shows that the free energy per unit area of a single surface is exactly the same as the tension exerted per unit length. Also, since the determination of the surface free energy has nearly always been done by a measurement of the force exerted by a surface, the term surface tension is always preferred to surface free energy, i.e. the surface tension of water is 72 mN m-1.

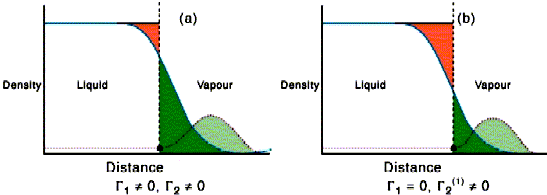
The situation for water soluble surfactants is quite different from that described in the previous paragraphs. There has to be equilibrium with the underlying solution. For solutions of surfactants below the CMC, progressive addition of surfactant lowers the surface tension of the solution. This occurs for two reasons. The first is because at the air water interface the hydrophilic group can remain in contact with the water while the hydrophobic group can partially escape from the water. The second is that the surface energy of a hydrocarbon layer is lower than that of water. The adsorption of surfactant at the interface will be opposed, however, by the loss of entropy of mixing. The balance between the two leads to the very important Gibbs equation, which relates the change of surface tension with concentration to the amount adsorbed at the surface. This can be used experimentally to determine how closely the amphiphiles pack and this, in turn, gives the value of the area occupied by the hydrophilic head group, which is the most convenient measure of the water hydrophilic head group interaction. The basis of the Gibbs equation is given in the panel below the next figure. Its derivation requires the definition of a dividing surface. This is a hypothetical surface which is regarded as making a perfect division between the two uniform bulk phases on either side of the surface. The contributions to the thermodynamic properties of the surface can then be separated into those of the two uniform bulk phases and an excess associated with the deviations from uniformity in the surface region. The surface excess of the solvent in the left hand side of the figure below is obtained by summing the red (negative excess relative to the uniform solvent) and green (positive excess). On the right hand side the dividing surface has been moved so that the red and green regions sum to zero. This move of the dividing surface has little effect on the surface excess of the very surface active solute in the figure.
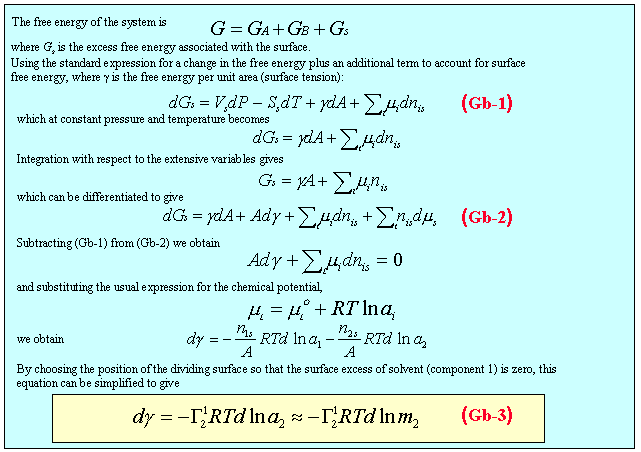
The Gibbs equation can be used to calculate the amount of a solute adsorbed from measurements of the surface tension. The slope of a plot of γ against logc is proportional to minus the amount of solute adsorbed. This is illustrated in the Gibbs isotherm java applet shown below. The parameters in this calculation are typical of surfactants adsorbed at the surface of water. The adsorption is modelled as though it obeys the Langmuir isotherm, which is often approximately the case, although, because the concentration axis is logarithmic, the appearance (right hand side) is different from the usual plot.The Gibbs equation corresponding to the isotherm on the right is plotted on the left. The pink circle can be moved by adjusting the adsorption bar. The tangent on the left corresponds to the position marked on the isotherm on the right. The Gibbs equation plot is cut off at a surface tension of 25 mN/m because equilibrium surface tensions seldom fall much below this. This cut-off would correspond to either a solubility limit or a critical micelle concentration.
The figure below shows a plot of surface tension against ln(c) for a non-ionic surfactant (the data is from the first Problem). Below the CMC, as the concentration increases (red curve), the magnitude of the negative slope of the curve increases, which corresponds to an increase in the amount adsorbed. The Gibbs equation is difficult to use above the CMC, although it is still applicable in principle. This is because above the CMC the concentration of surfactant monomer remains approximately constant because any excess forms micelles, i.e. dlnc is approximately zero. Since it is known from experiment that a saturated monolayer of surfactant is present at the surface above the CMC, the change in surface tension with concentration must also be close to zero, as observed. This part of the curve is shown in green in the figure. Its usefulness is only to help to define the exact CMC, which is the concentration at which the two curves intersect.
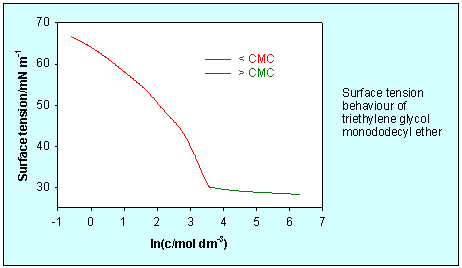
More advanced methods of studying the behaviour of amphiphiles at interfaces can be found in the research part of the website, e.g. Neutron Reflection or Neutron Reflection at the Air/Water Interface
Applets are programs written in Java that run on your own machine but they need the Java Virtual Machine to run them. This should be standard on most university or college computers. The Java VM can be downloaded free from http.java.sun.com. You only need to download it; it will sort itself out on your machine.
The applet programs can be downloaded on to your own machine so that you do not need to operate on-line. This has the advantage that you can make adjustments to the size of the diagram. The applet is run by a small *.html file. You can edit this (using NotePad, in which it comes up automatically if you select View Source from the View menu). You will see WIDTH and HEIGHT parameters in pixels. The applet should be resizable in the range from about 1000 to 400 pixels in WIDTH and you should change the HEIGHT parameter roughly in proportion. Download gibbs.jar with GibbsApplet.html for the Gibbs equation and ising.jar with IsingApplet.html for the simulation.