Neutron reflection is arguably the most powerful technique for exploring the structure of amphiphiles at equilibrium air/water surfaces. It determines the composition of the surface layer and gives low resolution structural information along the direction normal to the surface. The following gives an outline of how to optimize the technique and a typical data set is analysed by an interactive simulation using a Java applet.
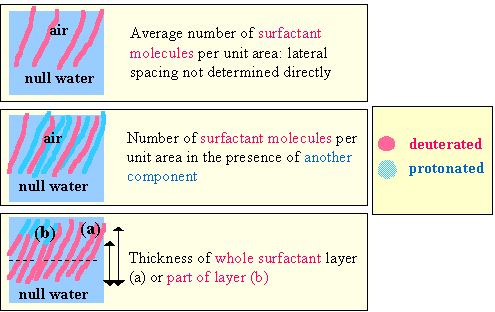
By suitable use of deuterium labeled materials the three basic pieces of information, surfactant thickness, the depth the surfactant penetrates into water and the surface coverage, shown diagrammatically in the figure below can be derived from the neutron reflectivity profile (note that the colour code for the contrast is as described in the section on contrast variation). However, by more elaborate labeling such as that shown in the lower two parts of the figure, the thickness of just part of the surfactant layer or the mean separation of two fragments along the surface normal direction can be determined. Such labelling schemes open up the opportunity of making a higher resolution study of a surfactant layer.
The determination of the extent to which an adsorbed layer is immersed in the aqueous subphase is illustrated in action by the applet below (click here for information concerning applets; the filenames here are techniques/solvent/solvent.jar and techniques/solvent/solventAppletJ.html). Three sets of data (not yet published) for a surfactant at the air/water interface at three isotopic compositions are shown. The surfactant is a slightly peculiar one and is expected to be largely immersed in the water. The sliders at the bottom of the applet allow you to make your own simultaneous fit to the three reflectivity profiles using a simple model of one or two uniform layers, depending on the contrast. The adjustable parameters are the area per adsorbed surfactant molecule, the thickness of the surfactant layer, the extent of penetration of the surfactant layer by water, and the volume of the surfactant. The last quantity comes into the calculation because, if the surfactant is immersed in water to any significant extent, the contribution of D2O to the scattering length density will be determined by the residual volume in the layer. The button at the bottom of the applet switches the contrast shown on the right. This enables you to judge more clearly what you are changing. However, the three profiles are fitted simultaneously irrespective of the contrast you have highlighted. The set of data can only be fitted with one model structure, which is quite accurately determined, but the way the various parameters affect the reflectivity shows that a single set of data at one contrast would not be sufficient to determine the structure with any certainty.
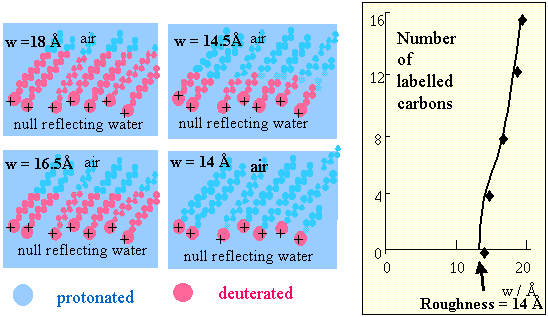
The method has been applied to the surfactant C16TAB, whose hydrocarbon chain is 16 atoms long. First it was labelled with deuterium to give a series of compounds with 4, 8, 12 and 16 CD groups (see figure below). The thicknesses of this series of compounds could then be used to show that there is a large residual roughness of the layer of 14 Å. This is obtained by plotting the measured thickness of the layer against number of labelled carbons and extrapolating to zero length of label.
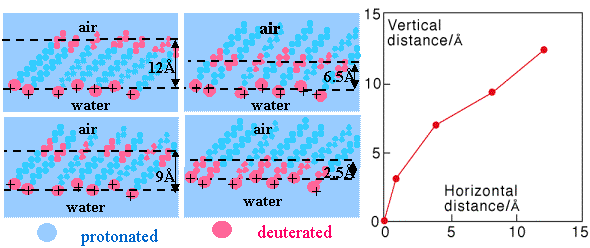
By making the same surfactant with different pairs of deuterium labelled butylene groups (4 carbon atoms) the mean vertical separation between the labels marked in red in the figure below was determined. Making the further assumption that each four carbon fragment is on average fully extended, the mean conformation of the carbon chain may be deduced, as shown in the figure below. This series of measurements shows that the surfactant layer must be highly disordered, the roughness being comparable with the projection of the chain along the surface normal, a result that agrees with computer simulations.
See also the Solid/Liquid Interface, Surfactant Mixtures, Polymer/Surfactant mixtures.